


Next: Conclusions
Up: Error analysis
Previous: Error sources
Return to the Publications.
Return to the Index.
The effects of different errors on the inverted aerosol and
molecular return and to the measured optical parameters
were calculated by partially differentiating Equations
(19), (20), and (4)--(13).
The error analysis is made for the data obtained on November 11, 1993.
A section of the data for a thin two-layer cirrus cloud structure is analyzed.
The case is the same as shown in Figure 31.
The thin cirrus cloud case is chosen for this study for two reasons.
First, the backscatter signal from thin high altitude cirrus
is small. Therefore, an error analysis made for the thin
cirrus tests the measurement sensitivity of the system.
Second, if accurate measurements of thin cirrus clouds can be made
within short averaging time, then the HSRL can be considered for
studies of contrail formed cirrus. The short averaging time is important
for the contrail studies, because they drift rapidly with the wind and
only a limited number of samples from one contrail can be obtained.
Information from cloud optical properties can be obtained
by comparing the HSRL measurements with satellite observations.
Thus, the averaging time of the HSRL data has to be close to the time
resolution of a satellite image.
The use of the short averaging times also prevents the smoothing of the
the lidar signal so that
the rapid changes in cloud structure in both time and altitude remain in the
data.
For this study, the 3 min averaging time was chosen to
study the errors in the inverted aerosol and molecular returns,
inverted aerosol and molecular depolarization ratios,
backscatter ratio, optical depth, and aerosol backscatter
cross section. Because the measurement of the backscatter phase
function is difficult due to uncertainty in the extinction
cross section determination, the 6 min averaging time was
used for error analysis of the phase function measurement.
The error analysis presented here shows the total errors together
with the partial errors. All errors are calculated as mean
square errors (see Equations 26-35) and presented as
fractional root mean square
errors (see Figures 37- 44).
The partial errors in Figures 37- 44
present the effects of errors on the photon counting of the combined
channel and the molecular channel, error in the molecular backscatter cross
section per unit volume due to the uncertainty in temperature and pressure
profiles, and errors in the calibration coefficient determination.
The error estimate calculations include the photon counting error,
error in the background correction, error due to the uncertainty
in the temperature and pressure profiles measured with a radiosonde,
and errors due to the tuning of the laser wavelength.
The errors due
to system alignment and
the error due to multiple scattering effects are not included to this
error analysis. Also the error in the determination of the range R is
negligible.
The errors in background correction are assumed to be from photon counting
statistics. The uncertainty of 2 % for the temperature
profiles is used. The error in pressure profile is estimated
to 1 mbar of the radiosonde pressure reading at each altitude.
The error is due to the geographic separation between closest weather stations.
This is estimated from the radiosonde measurements
from the closest weather stations. The uncertainty on the molecular
spectrum calculation is estimated with the 2% uncertainty
on the atmospheric temperature. The error
on the calibration coefficient  determination is
a combination of the photon counting error, uncertainty
of the molecular spectrum, and the error caused by tuning of
the laser wavelength.
The accuracy of the calibration coefficient
  determination
is limited by the photon counting statistics.
The error in the molecular backscatter cross section per unit volume
measurement depends on the errors in the atmospheric
temperature and pressure.
The error in the molecular profile can be given as

which leads to equation
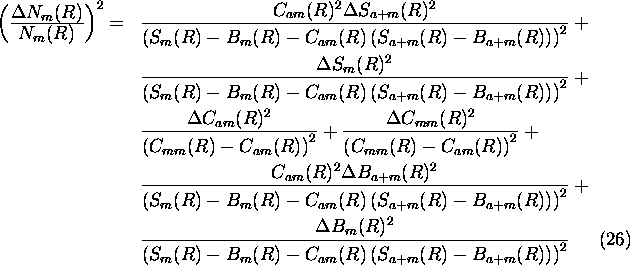
 and
and  are the photon counting errors.
 and
and  the errors in the
calibration coefficient determination.
The background correction errors are given by
  and
and  .
The error analysis made for the calibration coefficients show that
 can be determined with better than
5 % accuracy and
  with a better than 2 % accuracy.
The effects of different errors on the inverted molecular return
are shown in Figure 37. The errors in inverted molecular return
are dominated by the photon counting statistics and the determination
of the calibration coefficient  .
The error due to the
measurement accuracy of the aerosol signal is negligible.
The errors in the
  determination have only
a small effect on the inverted molecular return.
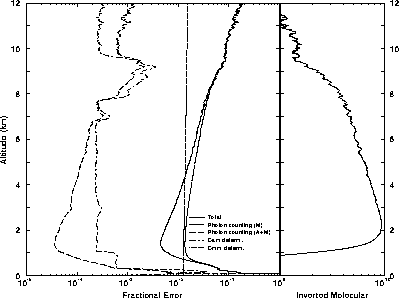
Figure 37: The effects of different errors on the inverted molecular
profile (November 11, 1993, 01:05-01:08 UT).
Data from a thin cirrus cloud is analyzed by using
a 3 min. averaging time. The measured molecular profile
(rightmost graph) presents
the signal variations as a function of altitude. The extinction
due to the thin cirrus cloud is observed between 6.5 and 10 km.
The accuracy of the inverted molecular return determination
is mostly limited by the photon counting statistics and the determination
accuracy of the calibration coefficient  (leftmost graph).
The large errors shown in the overlap region below 2 km are
due to a focus error and incomplete overlap of the receiver
field of view and transmitted laser beam.
The error in the measured aerosol profile can derived similarly to
the molecular profile

This differential equation can be expanded to following form
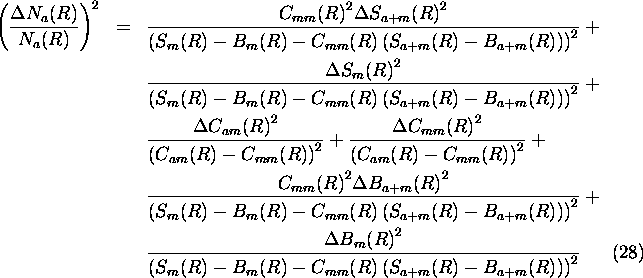
The accuracy of the inverted aerosol return is mostly affected by
the determination accuracy of the inverted molecular return
(photon counting statistics and  determination accuracy) and the
photon counting statistics of the combined aerosol and molecular channel
(see Figure 38).
For the cases of small aerosol backscatter content, large errors
in the determination of the aerosol return are made when short
averaging times are used. The errors are caused by subtracting
a large amount of molecular signal from the combined channel signal
that contains the strong molecular signal together with
a small aerosol contribution. Therefore, the statistics of
the molecular signal dominates the aerosol backscatter signal
determination.
The determination of clear
air aerosols requires longer averaging times in order to
achieve reliable results. On the other hand, the measurements of
cloud aerosols can be done with
  1.0% accuracy (7-10 km).
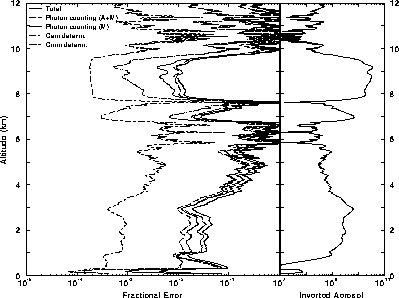
Figure 38: The effects of different errors on the inverted aerosol
profile in case of a thin cirrus cloud (November 11, 1993, 01:05-01:08 UT).
Averaging time of the data is 3 min. The measured aerosol profile
(rightmost graph)
shows the signal variation as function of altitude. The thin cirrus
layer is observed between 6.5 and 10 km and a strong aerosol layer
is seen between 0 and 3.5 km.
The measurements of the aerosols are limited by the accuracy of the
molecular profile measurements (leftmost graph). The 3 min averaging time
provides 1-5% accuracy for thin cirrus cloud and strong aerosol
layer measurements, but a longer averaging time is required for the
measurements of the clear air aerosols.
Using the calculated errors for the measured aerosol and molecular
profiles, the errors in the determination of the optical parameters
(see Chapter 2) can be calculated as follows.
The errors in the determination of inverted aerosol and
molecular returns have a direct effect on the accuracy of the
backscatter ratio (or scattering ratio) determination (Figure 39).
Therefore, the error in the backscatter ratio is

The effects of errors on photon counting, background correction,
and calibration can be derived by combining the previous equation with the
equations (26) and (28). Similar derivations
of the differential errors can be made for the optical parameters given
in following.
For the cases
of a low aerosol backscatter content, the errors in the backscatter ratio
are dominated by the errors in the aerosol return determination.
For a stronger aerosol backscatter return from a cloud, the errors
due to molecular return determination are on the same order or higher
than the errors due to aerosol return determination.
The backscatter ratios of the thin cirrus
and strong aerosol layers can be determined with better than 10%
accuracy, but measurements of the clear air
require longer averaging times.
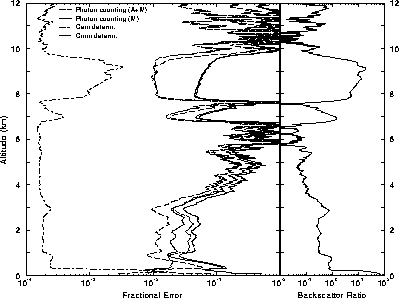
Figure 39: The effects of different errors on the backscatter ratio in case
of a thin cirrus cloud (November 11, 1993, 01:05-01:08 UT).
Averaging time of the data is 3 min. The backscatter ratio profile
(rightmost graph)
shows the ratio of the aerosol return to the molecular return as
a function of altitude. Backscatter ratios  0.1 to 20 are observed.
The
errors in the backscatter ratio measurement (leftmost graph) are determined by the
accuracy of the aerosol and molecular return measurements.
For the altitudes with a low aerosol content, the error in backscatter
ratio is limited by the accuracy of the aerosol backscatter return
measurement. For the cirrus cloud the accuracy depends on the
goodness of the molecular backscatter profile measurement.
The error in optical depth can be approximated as sum of error in the
molecular scattering cross section per unit volume and error in
the molecular return determination.

Error in the molecular scattering cross section per unit volume
 is determined by the uncertainties in the radiosonde based measurement
of the atmospheric
temperature and pressure.

Error in optical depth measurement is dominated
by the error in the determination of the molecular return
and the uncertainty on the density profile measured by a radiosonde
(see Figure 40). For this study, a 2% error in the temperature
profiles is assumed.
The closest radiosonde measurement site is
Green Bay (WI), which is  180 km northeast from the lidar.
Because the weather conditions can vary between the lidar site
and the closest weather station, larger errors in the temperature
profile are possible. The effects of errors on the atmospheric
density profile can be minimized by making radiosonde measurements on the
lidar site.
The figure shows, that with 3 min averaging time the cloud
optical depths
can be detected with  10 % accuracy. This accuracy is
sufficient when clouds with optical depths greater than 1 are measured.
For situations where optical depth is less than 1, a longer
averaging time is required.
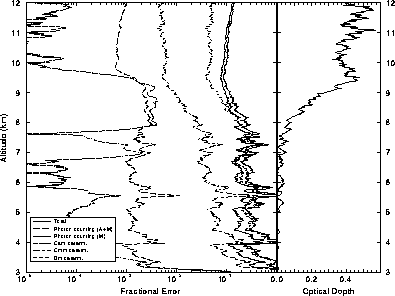
Figure 40: The effects of different errors to the optical depth in case
of a thin cirrus cloud (November 11, 1993, 01:05-01:08 UT).
Averaging time of the data is 3 min. The optical depth profile
(rightmost graph) shows
the variation of the optical depth as a function of altitude.
Optical depth of 0.5 is measuered for the range from 3 to 12 km
and optical depth of 0.4 is observed for the cirrus cloud between 6.5 and
10 km.
The errors in the measurement of the optical
depth below 6.5 km are dominated by the inaccuracy of the radiosonde profile
(leftmost graph) and the photon counting statistics of the molecular
channel.
The error in the
calibration coefficient  determination
also has a significant effect on the total error.
The optical depth of the thin cirrus cloud
can be measured with
  10% accuracy.
The accuracy of the aerosol backscatter cross section
measurement is limited by the accuracy of the molcular backscatter
cross section per unit volume determination and the accuracy
of the backscatter ratio.

The effects of different errors on the aerosol backscatter cross section
are shown in Figure 41. This figure shows, that the
measurements are mostly limited by the photon counting statistics, but also
the uncertainty on the  determination has a significant effect.
The aerosol backscatter cross sections of clouds and strong aerosol layers
can be observed with better than 10 % accuracy, but
the measurements of clear air aerosol backscatter cross sections
require longer averaging time.
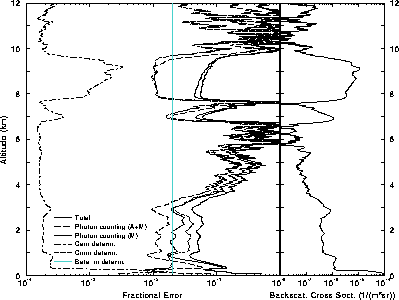
Figure 41: The effects of different errors to the aerosol
backscatter cross section in
case of a thin cirrus cloud (November 11, 1993, 01:05-01:08 UT).
Averaging time of the data is 3 min.
The aerosol backscatter profile is presented as a function
of altitude (rightmost graph)
and the backscatter cross section values range
from  to
to  .
The aerosol backscatter cross section of the cirrus cloud (6-10 km) and
the strong aerosol layer between 1 and 3.7 km can be
determined with 4-10 % accuracy, but the measurements of
the aerosol backscatter cross section of the clear air
require a longer averaging time (leftmost graph).
The error in the phase function is affected by the errors
on determinations of the molecular scattering cross section per unit volume,
the aerosol and molecular profile, and
the extinction cross section. These
errors can be further divided to the photon counting errors,
errors in the calibration coefficient determination, and
errors in the background subtraction.

Because the extinction section is a range derivative of the optical
depth, the determination accuracy of the molecular profile limits
the phase function measurements. For this study, the accuracy
of the phase function determination is estimated for a 6 min
section of the thin two-layer cirrus cloud.
The statistics obtained within 3 min averaging time is not
sufficient for the measurements of phase function profiles.
The accuracy of the phase function value determination can be
seen from Figure 42. The cloud phase function can be observed with
10-20% accuracy when 6 min averaging time is used.
By increasing the averaging time or the signal strength, accurate measurements
of cloud phase function profiles can be made.
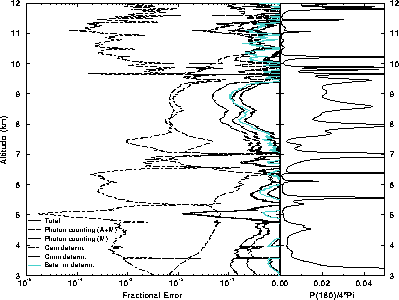
Figure 42: The effects of different errors on the phase function in case
of a thin cirrus cloud (November 11, 1993, 01:05-01:11 UT).
The 6 min averaging time is used.
The phase function profile is presented as a function of altitude
and the average phase function of the cirrus cloud layer between
7.5 and 10 km is 0.02 (rightmost graph).
The accuracy of the phase function measurements
is determined by the photon counting statistics, determination accuracy
of the calibration coefficients, and accuracy of the molecular
scattering cross section per unit volume (leftmost graph).
The accuracy achieved within 6 min averaging provides phase
function measurements with  20% accuracy for the cloud
layer.
Error in the inverted depolarization ratio can be presented as a sum of
errors in the parallel channel and the perpendicular channel signals.

The Fig 43 shows that the accuracy of the depolarization measurements
is mostly limited by the accuracy of the perpendicular
channel signal. The errors in the perpendicular channel signal
determination are dominated by the photon counting statistics. The
Figure 43 shows that short averaging times provide accurate
measurements of cloud depolarization, and therefore reliable separation
between water and ice clouds can be based on the depolarization measurements
of the HSRL. Also reliable depolarization
measurements of strong aerosol layers can be performed.
Figure 44 presents the errors in the molecular depolarization ratio.
The measurements of molecular depolarization ratio can be performed with
better than 10 % accuracy for the altitudes between 0.8 and 4 km.
Reliable measurements of molecular depolarization for higher altitudes
require longer averaging times. By using long averaging times
the effects of atmospheric temperature on the measured depolarization
can be studied.
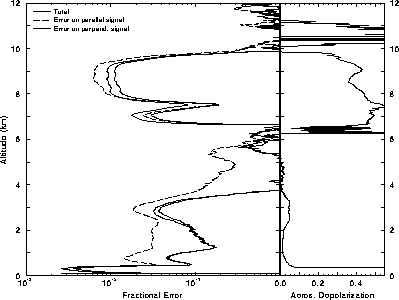
Figure 43: The effects of different errors to the inverted aerosol
depolarization ratio in case
of a thin cirrus cloud (November 11, 1993, 01:05-01:08 UT).
Averaging time of the data is 3 min.
The depolarization profile shows the variations of the inverted
aerosol depolarization as a function of altitude (rightmost graph).
A  40%
cirrus cloud depolarization is observed (6.5 - 10 km) and the depolarization
of the strong aerosol layer is
  5%.
The measurements of the inverted aerosol depolarization ratio
are limited by the accuracy of the perpendicular signal (leftmost graph).
The depolarizations of clouds can be measured with
 1 % accuracy. The depolarizations of strong aerosol layers are
obtained with better than 10% accuracy.
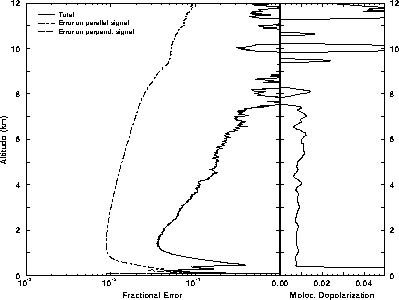
Figure 44: The effects of different errors on the inverted molecular
depolarization ratio in case
of a thin cirrus cloud (November 11, 1993, 01:05-01:08 UT).
Averaging time of the data is 3 min.
The depolarization profile shows the variations of the inverted
molecular depolarization as a function of altitude (rightmost graph).
A 0.8 %
depolarization is observed from 0.5 to 7 km.
The measurements of the molecular depolarization are limited
by the accuracy of the perpendicular signal measurement (leftmost graph).
For altitude between 0.8 and 4 km better than 10% accuracy is
achieved. Measurements molecular depolarization for the higher altitudes
require longer averaging times.


Next: Conclusions
Up: Error analysis
Previous: Error sources
Return to the Publications.
Return to the Index.
Paivi Piironen
Tue Mar 26 20:49:55 CST 1996
 determination is
a combination of the photon counting error, uncertainty
of the molecular spectrum, and the error caused by tuning of
the laser wavelength.
The accuracy of the calibration coefficient
  determination
is limited by the photon counting statistics.
The error in the molecular backscatter cross section per unit volume
measurement depends on the errors in the atmospheric
temperature and pressure.


 and
and  are the photon counting errors.
 and
and  the errors in the
calibration coefficient determination.
The background correction errors are given by
  and
and  .
The error analysis made for the calibration coefficients show that
 can be determined with better than
5 % accuracy and
  with a better than 2 % accuracy.
 .
The error due to the
measurement accuracy of the aerosol signal is negligible.
The errors in the
  determination have only
a small effect on the inverted molecular return.

 (leftmost graph).
The large errors shown in the overlap region below 2 km are
due to a focus error and incomplete overlap of the receiver
field of view and transmitted laser beam.


 determination accuracy) and the
photon counting statistics of the combined aerosol and molecular channel
(see Figure
  1.0% accuracy (7-10 km).


 0.1 to 20 are observed.
The
errors in the backscatter ratio measurement (leftmost graph) are determined by the
accuracy of the aerosol and molecular return measurements.
For the altitudes with a low aerosol content, the error in backscatter
ratio is limited by the accuracy of the aerosol backscatter return
measurement. For the cirrus cloud the accuracy depends on the
goodness of the molecular backscatter profile measurement.

 is determined by the uncertainties in the radiosonde based measurement
of the atmospheric
temperature and pressure.

 180 km northeast from the lidar.
Because the weather conditions can vary between the lidar site
and the closest weather station, larger errors in the temperature
profile are possible. The effects of errors on the atmospheric
density profile can be minimized by making radiosonde measurements on the
lidar site.
 10 % accuracy. This accuracy is
sufficient when clouds with optical depths greater than 1 are measured.
For situations where optical depth is less than 1, a longer
averaging time is required.

 determination
also has a significant effect on the total error.
The optical depth of the thin cirrus cloud
can be measured with
  10% accuracy.

 determination has a significant effect.
The aerosol backscatter cross sections of clouds and strong aerosol layers
can be observed with better than 10 % accuracy, but
the measurements of clear air aerosol backscatter cross sections
require longer averaging time.

 to
to  .
The aerosol backscatter cross section of the cirrus cloud (6-10 km) and
the strong aerosol layer between 1 and 3.7 km can be
determined with 4-10 % accuracy, but the measurements of
the aerosol backscatter cross section of the clear air
require a longer averaging time (leftmost graph).


 20% accuracy for the cloud
layer.


 40%
cirrus cloud depolarization is observed (6.5 - 10 km) and the depolarization
of the strong aerosol layer is
  5%.
The measurements of the inverted aerosol depolarization ratio
are limited by the accuracy of the perpendicular signal (leftmost graph).
The depolarizations of clouds can be measured with
 1 % accuracy. The depolarizations of strong aerosol layers are
obtained with better than 10% accuracy.
