 to
to  1000.
The maximum scattering ratio is 10 for the case presented
in Figure 31 and
  300 for the water cloud case in Figure
32.


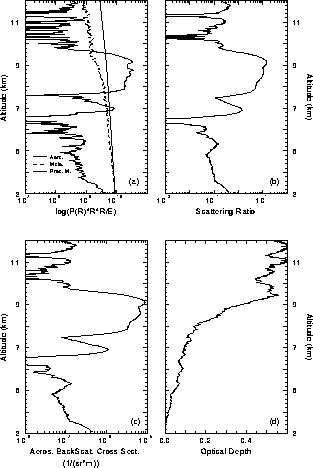
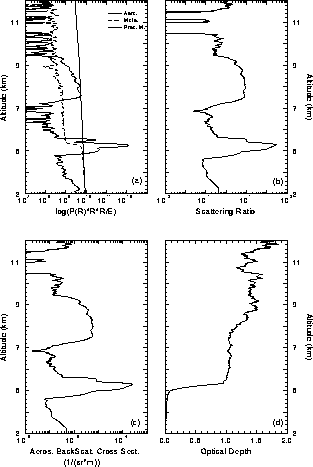
Two examples from the measured scattering ratio, aerosol backscatter cross section and optical depth profiles for the November 11, 1993 dataset are presented in figures 31 and 32. The cloud altitude and geometrical thickness of the clouds can be seen from the inverted aerosol profile. The inverted molecular signal shows the extinction in the signal through the atmosphere. This can be compared to the predicted Rayleigh return, calculated from the radiosonde data. The unsmoothed profiles are used. The Figure 31 shows a thin cirrus cloud case and the Figure 32 presents a water cloud together with a thin cirrus cloud. The water cloud is seen at 5.2 km altitude and the cirrus cloud can be found ranging from 7 to 9.2 km. The measured signals show the large dynamical range achieved in HSRL measurements: signal strength variations over four decades are seen.
The scattering ratio is calculated from the ratio of inverted
aerosol profile to the inverted molecular profile.
The measured scattering ratios for the whole dataset
vary from  to
to  1000.
The maximum scattering ratio is 10 for the case presented
in Figure 31 and
  300 for the water cloud case in Figure
32.
The aerosol backscatter cross section is obtained from the
scattering ratio and an estimate for the atmospheric density
profile.
The values of aerosol backscatter cross section
change from 
 for cirrus and ice precipitation
to
  for water cloud. The observed aerosol backscatter
values of the clear air are between
  and
and  .
.
The total optical depths are calculated from the ratio of the inverted
molecular signal to the return predicted for the pure molecular
scattering. They range from 0.5 to 2.5 for this dataset.
The Figure 31 shows a optical depth of 0.5 for the
cirrus cloud and a optical depth 1.4 is observed for the
case in Figure 32. The water cloud optical depth
is 1 and the cirrus cloud gives an optical depth of 0.4.
With the laser power used for this measurement, the optical
depth of 2.5 is the upper limit of the current system.
By increasing the laser output power larger optical depths can
be measured.
Because the cross talk between channels is small
and it can be accurately corrected, and also because the 160  rad
field of view of the HSRL effectively suppresses multiple scattering, the optical depths inside a cloud can be measured.
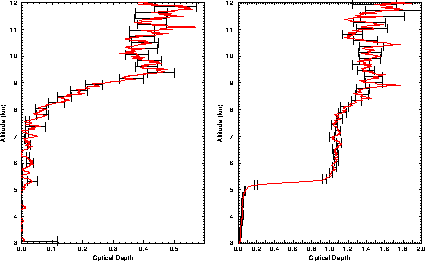
The accuracy of the optical depth measurements can be seen from
the Figure 33. The leftmost graph shows the error in the optical
depth measurement of a
thin cirrus cloud and rightmost graph shows
the error when a cirrus cloud of optical depth  1 is studied.
The errors presented here are root mean square errors
and they consist of photon counting, background
correction, calibration, and wavelength tuning errors.
The signals are spatially averaged with a 150 m filter and the
filtering is taken into account in the error analysis.
The accuracy of the optical depth measurements
is limited by the photon counting statistics. This
can be seen from the error bars, which are on the same order
as the signal fluctuations. The accuracy of the
HSRL measurements can be increased by increasing the signal
strength and/or by using a constrained nonlinear fit to the
inverted molecular profile.

Figure 31: The measured scattering ratio, aerosol backscatter cross section and
optical depth profiles of a thin cirrus cloud between 6.5 and 10 km
(November 11, 1993 01:05-01:09 UT).
(a) The inverted aerosol
and molecular profiles along with a calculated
molecular profile. The difference between the calculated and measured profiles
shows the extinction.
(b) The scattering ratio values
are ranging from  0.1 (clear
air between 3 and 6.5 km) to 10 (cirrus cloud at 10 km).
(c) The aerosol backscatter cross section of the cirrus cloud
is
  5
5 and
and  for
for  the clear air between altitudes 3 and 6.5 km.
(d) The optical depth between 3 and 11 km is 0.55. The optical depth
of the cirrus cloud is 0.4.

Figure 32: Scattering ratio, aerosol backscatter cross section and
optical depth profiles of a thin cirrus cloud between 7 and 9.2 km and
a water cloud
with an ice crystal precipitation at 5.2 km
(November 11, 1993 01:29-01:34 UT).
(a) The inverted aerosol and molecular profiles along with the calculated
molecular profile of the clear air.
(b) Scattering ratio of the water cloud is  300 and
10 for the cirrus cloud.
(c) The observed aerosol backscatter cross sections are ranging from
 for the clear air
to 2
 for the water cloud.
(d) The optical depth is 1 for the water cloud and 0.4 for the cirrus.

Figure 33: The root mean square errors in the optical depth measurement.
A thin cirrus case (November 11, 1993 01:05-01:09 UT) (leftmost graph) and
a cloud layer of optical depth of 1.4 (November 11, 1993 01:29-01:34 UT)
(rightmost graph).
The cases are the same as in Figure 29.
The error bars are of the same order as the signal fluctuations
indicating that the optical depth measurements are mostly limited
by the photon counting statistics.


