

Next: Error analysis
Up: Measurements
Previous: Measurements of scattering
Return to the Publications.
Return to the Index.
The temperature dependence of the Doppler-broadened molecular
spectrum enables the measurements of the atmospheric temperature
by a HSRL. The capability to measure the temperature would
eliminate the possible errors due to the difference between the radiosonde
reading and the current temperature over the lidar site. For this
purpose, the temperature measurement capabilities of the
University of Wisconsin HSRL were studied.
The presence of clouds and strong layers of clear air aerosols
will affect the shape of the molecular spectrum measured
with the HSRL. The temperature measurement method presented in
the following was used to test the capabilty of the HSRL to accurately
measure the molecular spectrum width for layers with small aerosol
content.
Lidars have been used for the measurements of the atmospheric
temperature profile by many lidar groups.
The technique proposed by Strauch et al. [44]
and Cooney [45]
allows calibrated temperature
measurements by using the rotational Raman spectrum of nitrogen.
With this technique about 1  C temperature accuracy at low
altitudes is achieved.
Kalshoven et al. [46] demonstrated a differential absorption lidar
method for temperature measurements. They used 2 laser wavelengths
and
  -absorption lines to measure atmospheric temperature up to
1 km altitude with 1
  C accuracy.
Later Endemann and Byer [47] reported
simultaneous measurements of atmospheric temperature and humidity
with a continuously tunable IR-lidar. They used a three-wavelength
differential absorption lidar technique and water vapor absorption lines.
With this technique
a 2.3
  C absolute accuracy was achieved.
In addition to Raman and differential absorption lidar techniques,
Keckhut et al. [48] used Rayleigh scattering lidar to measure
atmospheric temperature for altitudes 30--70 km.
The temperature measurements made with a high resolution lidar
have been reported by Alvarez et al. [16].
Their temperature measurement is based on the two
barium absorption filters with different bandpasses. Because the
strength of the signal received through an absorption cell is proportional to
the width of the Doppler-broadened spectrum, the information of the
signal strength together with a theoretical
calculation for the Doppler-broadened Rayleigh-Brillouin spectrum
can be used for the determination of the atmospheric temperature.
Their latest measurements have shown that only a 10  C accuracy is
achieved for profiles up to 5 km.
The preliminary measurements of the atmospheric temperature made
with the University of Wisconsin HSRL have been based on
one iodine absorption filter. For temperature measurements
the system transmission spectrum is measured by scanning the
laser wavelength over the iodine absorption spectrum, similarly as
in the system calibration scan. For one temperature profile,
data from 5 calibration scans were averaged. This was done
to increase the signal to noise ratio of the measurement.
The measured profile was calculated by
averaging the signal over a 300 m range with 1 km steps.
The signal from atmosphere and detected
through the iodine absorption cell is a convolution of the
Doppler-broadened molecular spectrum and the iodine absorption spectrum.
The Brillouin modified approximation for the Doppler-broadened spectrum
was used to calculate the molecular line shapes at temperatures
ranging from -70 to +30  C with 1
 C
resolution. The calculated line shapes were
convoluted with the measured iodine absorption spectrum.
In order to define the atmospheric temperature at certain altitude,
a least square fit was used to fit the measured profile to the
calculated profile. The temperature that produced the best fit
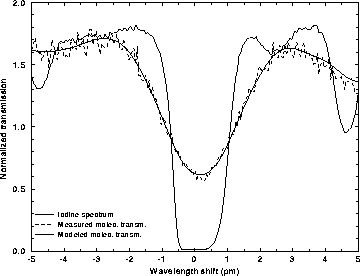
defined the temperature of that altitude. Figure 34
shows an example of the received signal from 8 km altitude
observed through the
iodine absorption cell normalized by the signal observed
with the channel without iodine absorption filter. The
iodine absorption spectrum is shown as a reference.
The modeled molecular profile is shown for the temperature that produced
the best fit. The best fit was found at -47
 C temperature.

Figure 34: The HSRL signal from 8 km altitude observed through the iodine absorption filter normalized by the signal measured simultaneously without the
iodine absorption filter. The iodine absorption spectrum is plotted
for reference. The modeled molecular transmission is shown for
the temperature that produced the best fit between measured
and calculated molecular transmissions. The best fit was obtained
at -47 C temperature.
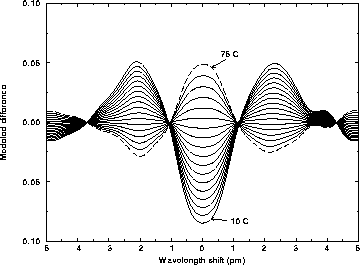
The sensitivity of the molecular transmission of the iodine absorption
filter to the width of the molecular spectrum is illustrated
in Figure 35. The figure shows the effect of incorrect
temperature to the fit. For this figure, the modeled molecular
transmissions were subtracted from the modeled molecular
transmission at -47  C temperature. The temperature difference
of 5
  C is displayed. The Figure 35 shows that
a clear difference between temperatures is achieved, but
because the differences are small, the accurate measurements of
atmospheric temperature by the scanning technique are difficult to obtain.

Figure 35: The sensitivity of the molecular transmission to the temperature.
The difference in modeled molecular
transmission to the molecular transmission at -47 C is shown with
5
 C temperature steps.
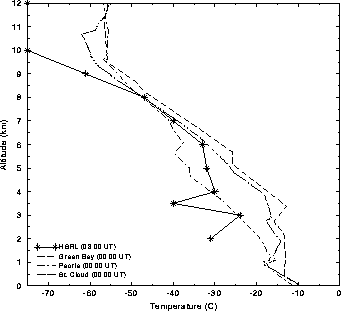
A temperature profile measured on February 27, 1994, in Madison
between 00:00 and 03:00 UT
is presented in Figure 36.
For the comparison the
radiosonde temperature profiles from nearest weather stations
are presented. The stations at Green Bay (WI, 180 km northeast from
Madison), Peoria (IL, 350 km south from Madison),
and St. Cloud (MN, 450 northwest from Madison)
provided a radiosonde profile at 00:00 UT.
The temperature values measured by the HSRL
agree with the temperatures measured with the radiosondes.
For the profile between 4 and 8 km the observed rms temperature
differences are 2.97, 7.08, and 5.52  C between HSRL and the
weather stations. The rms difference between weather stations
is 7.06
  C.
For low altitudes, the largest difference between profiles is
observed. This is expected because of the synoptic scale variations
in weather conditions between different locations.
For altitudes between 6-8 km, a good agreement between HSRL measurement
and the central Minnesota (St. Cloud) radiosonde profile is seen.
These altitudes had a low aerosol content providing scattering ratio
of  0.02.
The temperatures
above 8 km show a big deviation from the radiosonde temparatures. This
is due a strong aerosol layer, that disturbs the HSRL
temperature measurement.
The scattering ratio of the aerosol layer above 8 km was
  0.3.
Also the measured temperature values for altitude between 2 and
3.5 km are colder than the radiosonde values. This is due to
presence of a low level aerosol layer with scattering ratio of
  0.1
The presence of aerosols deepens the measured spectrum and therefore
a fit into this spectrum underestimates the temperature.
Therefore, if the temperatures are going to be measured
in the presence of aerosols, the effect of the aerosol signal
has to be separated from the molecular contribution.

Figure 36: A temperature profile obtained with the HSRL on February 27, 1994.
The temperature profile
obtained with radiosondes show the atmospheric temperature measured at
the closest weather stations. A good agreement between HSRL and radiosonde
observations is observed between altitudes of 4 and 8 km. These are
altitudes with a low aerosol backscatter content.


Next: Error analysis
Up: Measurements
Previous: Measurements of scattering
Return to the Publications.
Return to the Index.
Paivi Piironen
Tue Mar 26 20:49:55 CST 1996
 C temperature accuracy at low
altitudes is achieved.
Kalshoven et al. [46] demonstrated a differential absorption lidar
method for temperature measurements. They used 2 laser wavelengths
and
  -absorption lines to measure atmospheric temperature up to
1 km altitude with 1
  C accuracy.
Later Endemann and Byer [47] reported
simultaneous measurements of atmospheric temperature and humidity
with a continuously tunable IR-lidar. They used a three-wavelength
differential absorption lidar technique and water vapor absorption lines.
With this technique
a 2.3
  C absolute accuracy was achieved.
In addition to Raman and differential absorption lidar techniques,
Keckhut et al. [48] used Rayleigh scattering lidar to measure
atmospheric temperature for altitudes 30--70 km.


 C accuracy is
achieved for profiles up to 5 km.
 C with 1
 C
resolution. The calculated line shapes were
convoluted with the measured iodine absorption spectrum.
In order to define the atmospheric temperature at certain altitude,
a least square fit was used to fit the measured profile to the
calculated profile. The temperature that produced the best fit
defined the temperature of that altitude. Figure
  C temperature.

 C temperature.
 C temperature. The temperature difference
of 5
  C is displayed. The Figure
 C is shown with
5
 C temperature steps.
 C between HSRL and the
weather stations. The rms difference between weather stations
is 7.06
  C.
For low altitudes, the largest difference between profiles is
observed. This is expected because of the synoptic scale variations
in weather conditions between different locations.
 0.02.
The temperatures
above 8 km show a big deviation from the radiosonde temparatures. This
is due a strong aerosol layer, that disturbs the HSRL
temperature measurement.
The scattering ratio of the aerosol layer above 8 km was
  0.3.
Also the measured temperature values for altitude between 2 and
3.5 km are colder than the radiosonde values. This is due to
presence of a low level aerosol layer with scattering ratio of
  0.1
The presence of aerosols deepens the measured spectrum and therefore
a fit into this spectrum underestimates the temperature.
Therefore, if the temperatures are going to be measured
in the presence of aerosols, the effect of the aerosol signal
has to be separated from the molecular contribution.
