


Next: Depolarization ratio
Up: A HIGH SPECTRAL RESOLUTION
Previous: The laser wavelength
Return to the Publications.
Return to the Index.
Starting from July 1993, the iodine absorption filter based
HSRL has been operated at the University of Wisconsin-Madison campus.
During this time the HSRL has been routinely operated and
the stability and reliability of the system have been tested.
As a result, a dataset consisting of  30 different cirrus
cloud cases has been obtained with a simultaneous NOAA-11 and/or
NOAA-12 satellite overpasses.
As an example from the data collected with the HSRL a dataset
from November 11, 1993 is shown. This dataset contains a meteorologically
interesting case: a cirrus cloud, supercooled water cloud, and
ice crystal precipitation together with a strong low level aerosol
structure.
Figures 19 - 25 present Range Time Indicator (RTI) pictures
from the data. Both raw and inverted
data are shown along with depolarization and optical
depth. The pictures are generated from the background
corrected, energy normalized, and range square corrected data.
For the RTI's
of the inverted data,
the aerosol and molecular signals are separated by using Equations 19 and 20.
The optical depth is obtained from the ratio of the inverted
molecular profile to the return predicted for the pure molecular
scattering (Eq. 10).
The color scale shows the signal strength and the white areas
are regions where the backscatter signal is larger than the maximum
color scale value. The black areas indicate that the signal is
smaller than the smallest color scale value.
The Figure 19 shows the
raw lidar return detected with the combined aerosol and molecular
channel. This profile is similar to the profile obtained with
a conventional single channel lidar: the signal from small amounts
of aerosol scatterers is dominated by the scattering from molecules,
and therefore all aerosol structures are not clearly visible.
The ability of the HSRL to
separate aerosol and molecular scattering
can be seen from the RTI picture of the inverted aerosol
signal Figure 20. After inversion, the aerosol structures
are more visible and
they do not have the decrease with altitude caused by
the atmospheric density profile.
The ability of the iodine absorption filter to reject
aerosol scattering is visible from the RTI of the
raw molecular signal (see Figure 21):
only a small aerosol cross-talk for the
densest parts of the clouds is observed and this is easily removed by
the inversion, as can be seen from Figure 22.
The phase of the water at different layers can be seen from the
depolarization RTI's. Figure 23 shows the raw depolarization observed
with the combined aerosol and molecular channel. The inverted
aerosol depolarization is shown in the Figure 24.
From these pictures, a cirrus cloud at  8 km
(depolarization ratio
  40%) and a supercooled
water cloud at 5 km ( depolarization ratio
  1 %)
with ice crystal precipitation can be easily separated.
For low level aerosols (0-3.7 km), a two layer polarization structure
is seen.
The small increase in water cloud depolarization as
a function of cloud height is an indicator of multiple scattering.
The low molecular depolarization is presented in Figure 25.
The low depolarization ratio values with small signal to noise ratio
show up in the picture as noise.
The optical depths on the different parts of the data set can be
seen from the Figure 26.
The optical depth of the cirrus cloud between 7 and 10 km is  0.4.
The water cloud at
  5 km has an optical depth of 2.5-3. The
extinction through the ice crystal precipitation below the water cloud
and the extinction through the water cloud can be seen as a change
in the color scale as a function of altitude.
The optical depth of the ice crystal precipitation
is
  0.1.
0.1.
A more detailed analysis of the dataset is presented in the following
sections.
First, the depolarization measurements are discussed in Chapter 7.1.
The effects of multiple scattering to the depolarization measurements
are shown. The measurements of the cloud particle sizes
are not included to this study.
The depolarization data from August to November 1993 is
analyzed and
a summary from the observed depolarizations as a function
of atmospheric temperature is given.
Second, an example from a measurement of scattering ratio, aerosol
backscatter cross section, and optical depth
is given together with error estimates for the optical depths (see Chapter
7.2).
The temperature dependence of the Doppler-broadened
molecular spectrum enables the measurements of the atmospheric
temperature by the HSRL. Preliminary results from a temperature
measurement are presented in Chapter 7.4.
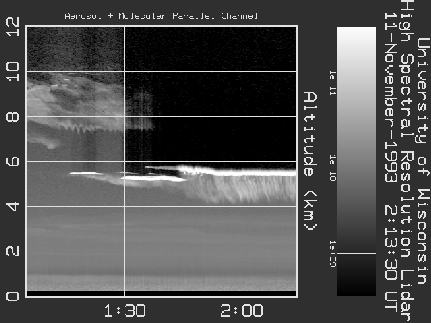
Figure 19: The raw lidar return presenting the combined aerosol
and molecular channel return. A water cloud layer
with an ice crystal precipitation are seen at 5 km. Above the water cloud,
a cirrus cloud can be seen.
The
low level aerosol structure between 0 and 3.7 km is hardly visible because it
is damped by
the molecular backscatter signal.
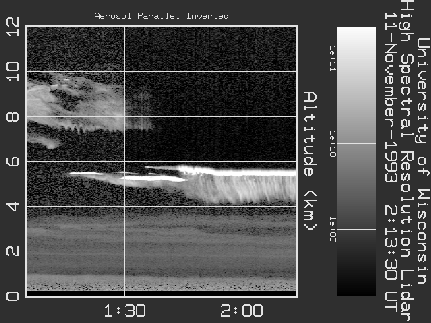
Figure 20: The inverted aerosol profile. After separating the
aerosol and molecular backscatter returns, the layers where
the aerosol backscatter signal is small compared to the molecular signal
are clearly visible. The largest difference is seen for the
low level aerosol layer between 0 and 3.7 km.
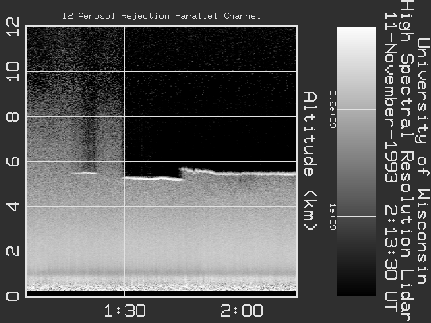
Figure 21: The raw molecular return. A small aerosol cross talk signal
is visible for the densest parts of the water cloud at  5.5 km.
The dark areas indicate that very little or no return through
parts of the water cloud is observed.
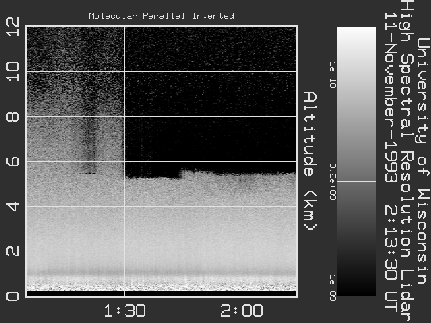
Figure 22: The inverted molecular profile. After the inversion,
the cross talk that was visible in Figure 21 cannot
be seen and the inverted molecular profile therefore
presents the atmospheric extinction at various points of the
dataset. The inaccuracy of the overlap correction can be seen
as a darker line at  1 km.
1 km.
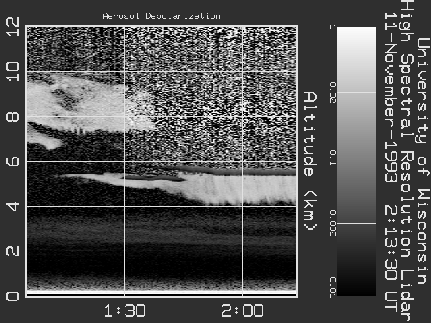
Figure 23: The raw aerosol depolarization combined with the molecular
depolarization. The picture shows the depolarization ratio that is
seen with a lidar that cannot separate the aerosol and molecular
backscatter signals. The depolarizations for altitudes with low
aerosol content are
dominated by the molecular depolarization. The parts of the
cirrus cloud and parts of the ice crystal precipitation between 4 and
5.5 km show depolarization ratios that are  10%, and
those layers could be expected to contain mixture of ice and water.
Some parts of aerosol
layer between 2 and 3.7 km show depolarization of
  3.5 %.
The water cloud at 5.5 km has
  1% depolarization.
The increase in the water cloud depolarization as a function of altitude
is due to the
multiple scattering.
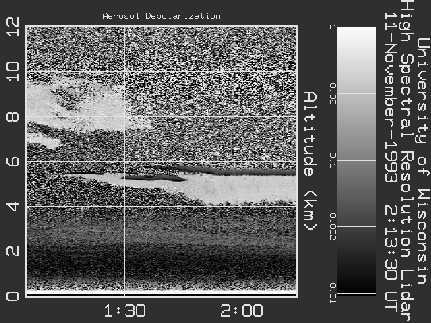
Figure 24: The inverted aerosol depolarization. After inversion,
the cirrus cloud depolarization of  40% indicates pure
ice depolarization. The ice crystal precipitation falling
out from the water cloud show similar depolarizations values.
The low level aerosol structure shows a two layer polarization
structure. A
  1% depolarization ratio for the
layer between 0.5-2 km is observed indicating nearly spherical particles.
The depolarization of the layer between 2 and 3.7 km shows
a
  5% depolarization.
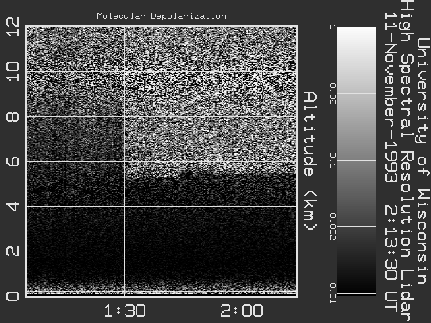
Figure 25: The inverted molecular depolarization. A less than 1% molecular
depolarization is observed. The increase in the depolarization
variations at the
higher altitude is due to the low signal to noise ratio.
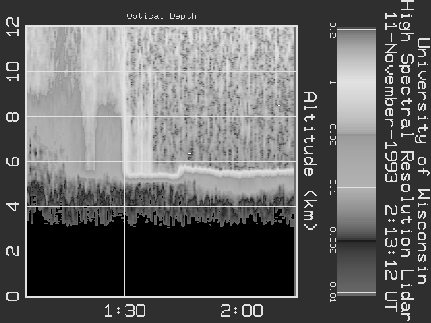
Figure 26: The optical depth. The optical depth above 3 km is shown.
The optical depth of the cirrus cloud between 7 and 10 km is  0.4.
The water cloud at
  5 km has a optical depth of 2.5-3. The
extinction through the ice crystal precipitation below the water cloud
and the extinction through the water cloud can be seen as a change
in the color scale. The optical depth of the ice crystal precipitation
is
  0.1.
0.1.


Next: Depolarization ratio
Up: A HIGH SPECTRAL RESOLUTION
Previous: The laser wavelength
Return to the Publications.
Return to the Index.
Paivi Piironen
Tue Mar 26 20:49:55 CST 1996
 30 different cirrus
cloud cases has been obtained with a simultaneous NOAA-11 and/or
NOAA-12 satellite overpasses.
As an example from the data collected with the HSRL a dataset
from November 11, 1993 is shown. This dataset contains a meteorologically
interesting case: a cirrus cloud, supercooled water cloud, and
ice crystal precipitation together with a strong low level aerosol
structure.
Figures 19 - 25 present Range Time Indicator (RTI) pictures
from the data. Both raw and inverted
data are shown along with depolarization and optical
depth. The pictures are generated from the background
corrected, energy normalized, and range square corrected data.


 8 km
(depolarization ratio
  40%) and a supercooled
water cloud at 5 km ( depolarization ratio
  1 %)
with ice crystal precipitation can be easily separated.
For low level aerosols (0-3.7 km), a two layer polarization structure
is seen.
The small increase in water cloud depolarization as
a function of cloud height is an indicator of multiple scattering.
The low molecular depolarization is presented in Figure
  0.4.
The water cloud at
  5 km has an optical depth of 2.5-3. The
extinction through the ice crystal precipitation below the water cloud
and the extinction through the water cloud can be seen as a change
in the color scale as a function of altitude.
The optical depth of the ice crystal precipitation
is
  0.1.
0.1.


 5.5 km.
The dark areas indicate that very little or no return through
parts of the water cloud is observed.

 1 km.
1 km.

 10%, and
those layers could be expected to contain mixture of ice and water.
Some parts of aerosol
layer between 2 and 3.7 km show depolarization of
  3.5 %.
The water cloud at 5.5 km has
  1% depolarization.
The increase in the water cloud depolarization as a function of altitude
is due to the
multiple scattering.

 40% indicates pure
ice depolarization. The ice crystal precipitation falling
out from the water cloud show similar depolarizations values.
The low level aerosol structure shows a two layer polarization
structure. A
  1% depolarization ratio for the
layer between 0.5-2 km is observed indicating nearly spherical particles.
The depolarization of the layer between 2 and 3.7 km shows
a
  5% depolarization.


 0.4.
The water cloud at
  5 km has a optical depth of 2.5-3. The
extinction through the ice crystal precipitation below the water cloud
and the extinction through the water cloud can be seen as a change
in the color scale. The optical depth of the ice crystal precipitation
is
  0.1.
0.1.