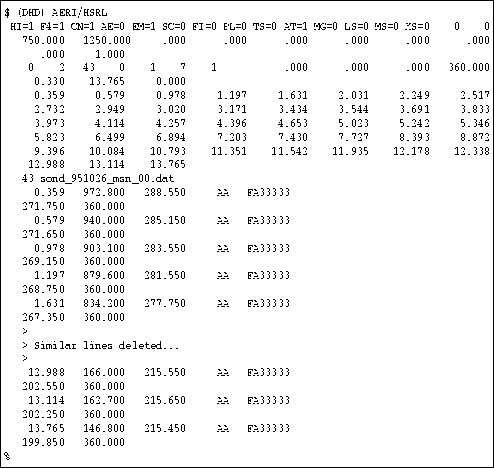
Figure 38: Portion of a typical FASCOD3P `TAPE5' data file. It is used to set various model parameters and input atmospheric temperature and water vapor profiles as a function of altitude.
Return to the Publications.
Return to the Index.

Figure 38: Portion of a typical FASCOD3P `TAPE5' data file. It is used to set
various model parameters and input atmospheric temperature and
water vapor profiles as a function of altitude.
The input file is comprised of three sub-sections: model calculation parameters, representative altitude levels, and the atmospheric aerological profile determined from radiosonde data at the chosen altitude levels [Anderson ChetwyndAnderson Chetwynd1992]. A $ symbol indicates the beginning of the input file, followed by an 80-character information header. The second row determines various parameters used by the model, summarized in Table 7.
| Parameter | Value | Definition |
| HI | 1 | Use Voight profile |
| F4 | 1 | Use 25 cm |
| CN | 1 | Default for atmospheric calculations |
| AE | 0 | No aerosol calculations |
| EM | 1 | Calculate radiance and transmittance |
| SC | 0 | Default |
| FI | 0 | Default |
| PL | 0 | Default |
| TS | 0 | Default |
| AT | 1 | Atmosphere |
| MG | 0 | Default, merge data to output file |
| LS | 0 | No laser parameters |
| MS | 0 | No multiple scattering |
| XS | 0 | No cross-sections |
Rows 3 through 6 indicate boundaries: spectral, spatial, and
direction of calculation. The first two terms in row 3 are the
spectral limits; from 750 to 1250 cm![]() for this example. The following
terms in row 3 relate to the spectral linewidth and strength to use
for various cases; each set to .000 to accept the default values. Row
4 sets the boundary temperature and emissivity; 0.000 and 1.000,
respectively for space observation from the earth's
surface. Table 8 lists the row 5 settings. Row 6
indicates begin (H1) and end (H2) altitudes and slant angle; 0.330
through 13.765 km for a zenith view (.000).
for this example. The following
terms in row 3 relate to the spectral linewidth and strength to use
for various cases; each set to .000 to accept the default values. Row
4 sets the boundary temperature and emissivity; 0.000 and 1.000,
respectively for space observation from the earth's
surface. Table 8 lists the row 5 settings. Row 6
indicates begin (H1) and end (H2) altitudes and slant angle; 0.330
through 13.765 km for a zenith view (.000).
| Value | Definition |
| 0 | User supplied profile (radiosonde) |
| 2 | Path, from H1 to H2 (row 6) |
| 43 | Levels in profile, maximum of 64 |
| 0 | Default, zero absorber if less than 0.1% of total |
| 1 | Short printout |
| 7 | Default, number of molecular species |
| 1 | Write layer data to output file |
| .000 | Default, earth radius = 6371.23 km |
| .000 | Default, altitude of space = 100 km |
| .000 | Default, use mean frequency for refractive geometry |
| 360.000 | Mixing ratio (ppmv) for CO |
The next several rows, 7 through 12 in this case, suggest the altitude levels which best represent the radiosonde temperature and moisture profile; where roughly 500 data points are reduced to approximately 50. A 24 character information header, used to infer the number of points and filename of the complete radiosonde data file, separates the altitude level listing from the radiosonde data.
The remaining rows describe the radiosonde data corresponding to each
altitude level; where two rows are used for each
level. Information is given as follows: altitude (km); pressure (mb);
temperature (K); units indicator, AA, for this row; and units indicator,
FA33333, for next row. The following line: dewpoint temperature (K),
and CO![]() mixing ratio (ppmv). The AA specifies pressure
and temperature units. FA33333 implies: F, dewpoint units; A, CO
mixing ratio (ppmv). The AA specifies pressure
and temperature units. FA33333 implies: F, dewpoint units; A, CO![]() units;
and 33333, default to value for model mid-latitude winter atmosphere
for the remaining 5
atmospheric species (O
units;
and 33333, default to value for model mid-latitude winter atmosphere
for the remaining 5
atmospheric species (O![]() , N
, N![]() O, CO, CH
O, CO, CH![]() , and O
, and O![]() ). This is
repeated for each altitude. A % symbol indicates end of file.
The HITRAN92 atmospheric transmission database is the source for the
FASCOD3P transmission data.
). This is
repeated for each altitude. A % symbol indicates end of file.
The HITRAN92 atmospheric transmission database is the source for the
FASCOD3P transmission data.