Return to the Publications.
Return to the Index.
The calculation of a brightness temperature within a spectral bandpass is inconsistent with the true temperature; where the error increases with larger bandpass. This is a result of solving
![]()
based on a single wavenumber representation of the given bandpass.
A correction can be applied by assuming a linear representation of the temperature in the Planck function, such that
![]()
where a and b are the y-intercept and slope, respectively, determined
with a least squares fit over an expected temperature range using the
central bandpass wavenumber, ![]() .
.
For ground-based measurements of downwelling radiance in the
atmospheric window, a typical
brightness temperature range is between 150 and 270 K; dependent upon
cloud base altitude and optical depth. The theoretical radiance,
integrated over the spectral bandpass, is calculated in 1 K increments
in the given temperature domain. Brightness temperature, ![]() ,
is determined using the theoretical radiance and
,
is determined using the theoretical radiance and ![]() . A least
squares fit to these values is performed to yield the necessary
adjustment; where the corrected form is represented as
. A least
squares fit to these values is performed to yield the necessary
adjustment; where the corrected form is represented as

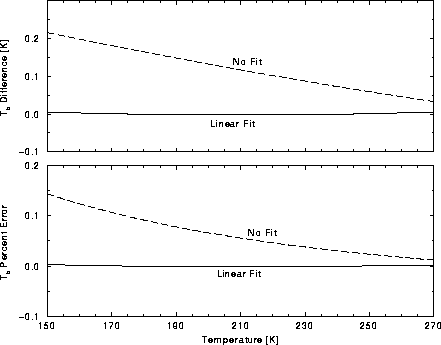
Figure 37 illustrates the relative error (upper figure)
and percent error (lower figure) in deriving the brightness
temperature from radiance data in a spectral bandpass. Corrected and
uncorrected values are represented by the solid and dashed curves,
respectively, using a bandpass of 909 to 1000 cm ![]() (10 to 11
(10 to 11 ![]() m)
over the temperature domain 150 to 270 K.
m)
over the temperature domain 150 to 270 K.

Figure 37: A comparison of broadband brightness temperature using
parameterized Planck function linear in temperature (solid line) and
standard Planck function (dashed line); each using the mean
wavenumber, relative to the theoretical value. The upper figure
represents temperature difference from theoretical, while the lower
gives percent error.