

Next: Brightness Temperature Linear Fit
Up: Abstract and Contents
Previous: Conclusion
Return to the Publications.
Return to the Index.
A number of regions exist between atmospheric absorption
lines which can be observed by the high spectral resolution of the
AERI, see Table 6. These `microwindows' comprise the
least absorbing regions within the spectral bandpass of the instrument.
|
Window | Start Window [cm ] ] | End Window [cm ] ] |
| 1 | 770.969 | 774.827 |
|
2 | 785.917 | 790.739 |
|
3 | 809.061 | 812.919 |
|
4 | 815.330 | 824.491 |
|
5 | 828.348 | 834.617 |
|
6 | 842.814 | 848.118 |
|
7 | 860.172 | 864.030 |
|
8 | 872.227 | 877.531 |
|
9 | 891.996 | 895.853 |
|
10 | 898.264 | 905.497 |
|
11 | 929.606 | 939.731 |
|
12 | 959.983 | 964.323 |
|
13 | 985.056 | 998.075 |
|
14 | 1076.670 | 1084.867 |
|
15 | 1092.100 | 1098.850 |
|
16 | 1113.316 | 1116.691 |
|
17 | 1124.406 | 1132.603 |
|
18 | 1142.246 | 1148.032 |
|
19 | 1155.265 | 1163.462 |
Table 6: AERI Microwindow Regions
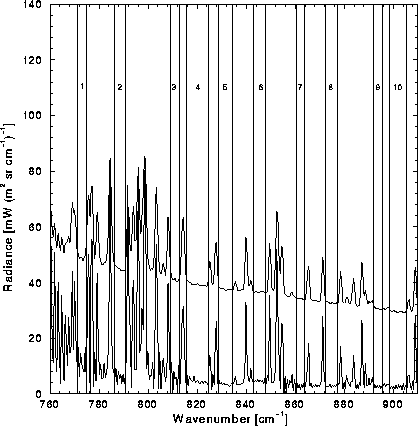
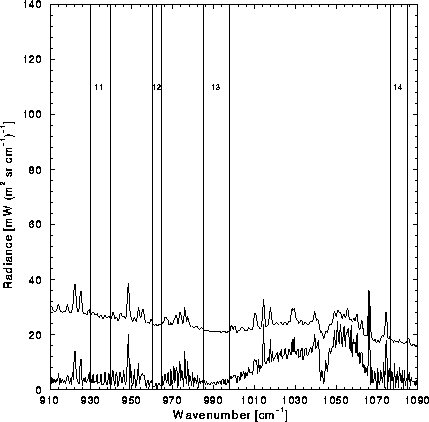
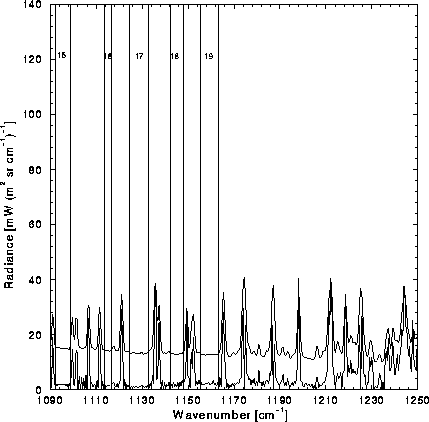
Figures 34 through 36 note these regions and
illustrate
the change in AERI measured radiance due to the presence of cirrus
(upper curve) relative to a clear atmosphere (lower curve). Aerosol
loading (e.g., wind blown dust, increased humidity, industrial
effluence) will also yield higher microwindow emission.

Figure 34: A visualization of AERI microwindow regions listed in
Table 6, where the upper curve represents a cirrus case
and the lower a clear atmosphere, 760 through 910 cm .
.

Figure 35: Spectral continuation of Figure 34, see previous caption, 910
through 1090 cm .
.

Figure 36: Continuation of Figure 35, see previous caption, 1090
through 1250 cm .
.


Next: Brightness Temperature Linear Fit
Up: Abstract and Contents
Previous: Conclusion
Daniel DeSlover
Sun Aug 11 10:02:40 CDT 1996


