


Cloud coverage is defined as the percentage of
ground surface area with clouds directly above.
This study uses the following procedure to calculate the
cloud coverage from the VIL data.
The cloud echoes and signal echoes are mapped onto a horizontal grid
according to their horizontal positions.
The ratio of grid points with cloud echoes to
grid points with signal echoes defines the cloud coverage percentage.
The VIL can map clouds on areas
as small as 2000 m within the scanning area.
Cloud coverage estimation
is also possible using a larger portion of the scanning area
up to 70 km
within the scanning area.
Cloud coverage estimation
is also possible using a larger portion of the scanning area
up to 70 km .
.
The measurement geometry limits the accuracy of
the cloud coverage estimates.
Coverage decreases towards the end of the scan range
since the lowest cloud elements at close range
may block the view of clouds with slightly higher bases.
To minimize this error,
the cloud coverage is calculated for a 5 km long and 5 km wide grid
starting from the closest possible range for
the current cloud base altitude and the maximum elevation angle of the scan.
In terms of elevation angles, this means that the coverage of a
cloud layer at 1 km is measured using scanning angles between
6.5 and 15
 .
Figure 17 presents the cloud echo projections to the ground and
the spatial coverage of the backscattering returns.
Cloud coverage is about 25%.
.
Figure 17 presents the cloud echo projections to the ground and
the spatial coverage of the backscattering returns.
Cloud coverage is about 25%.
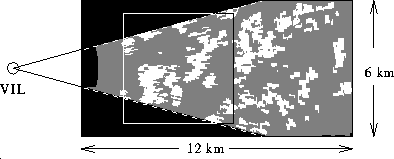
Figure 17: Horizontal map of VIL cloud echoes on the ground on July 26, 1989,
at 11:00 CDT.
Gray and white areas indicate coverage by VIL backscatter profiles
and VIL cloud echoes, respectively.
The areas outside the scanning area are shown as black.
The 5 km  5 km square estimates the area where the cloud coverage
is calculated.
5 km square estimates the area where the cloud coverage
is calculated.
To verify the cloud mapping capability of the VIL,
cloud coverage estimates are compared with satellite imagery data.
Figure 18 compares
cloud mapping based on the VIL data with the visual wavelength
band (0.572--0.698  m) image of the satellite-based
Advanced Very High Resolution Radiometer (AVHRR) instrument on the NOAA-11
satellite platform.
The cloud base altitude was 1.4 km; the cloud top altitude was 2.4 km.
The view angle of the AVHRR was 21.9
m) image of the satellite-based
Advanced Very High Resolution Radiometer (AVHRR) instrument on the NOAA-11
satellite platform.
The cloud base altitude was 1.4 km; the cloud top altitude was 2.4 km.
The view angle of the AVHRR was 21.9 from zenith and
258.5
from zenith and
258.5 clockwise from North.
Similar cloud structures can be seen in both images.
The main differences are due to the spatial resolution;
the area resolution of VIL is about five hundred times better than the
1 km
clockwise from North.
Similar cloud structures can be seen in both images.
The main differences are due to the spatial resolution;
the area resolution of VIL is about five hundred times better than the
1 km pixel resolution of the AVHRR.
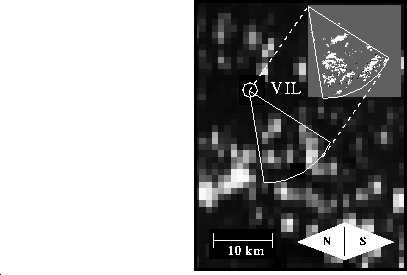
Figure 18: Comparison of a VIL cloud map
(rectangle at upper-right corner)
and an AVHRR visual band image (background)
on July 28, 1989, at 15:01 CDT.
The AVHRR image is enhanced to show clouds as white and the ground as black.
The arc represents the VIL scanning area.
The VIL cloud map correlates with the AVHRR cloud map.
The percentage of the ground shadowed by clouds generally differs
from the cloud coverage.
In most studies requiring cloud shadow information, shadows are
estimated using an assumed cloud shape and cloud coverage measurements.
This works well in large areas,
but when large scale cloud shadow estimates are combined with
local scale radiometric measurements, the result may be biased because
the local cloud coverage and shadows can differ substantially.
Clouds can block the direct sunlight,
but the sky may be clear directly above, and vice versa.
The cloud mapping capabilities of the VIL enable
determination of cloud shadows on the ground.
In Figure 19,
a measured volume scan and sun angle information
are used to construct a realistic view of the CBL.
Cloud shadows are restored by geometrically projecting the cloud returns
onto the ground using an actual sun angle.
The cloud shadow estimates can be calculated for areas as small as
2000 m in the scanning area of the VIL.
The large scanning volume and good spatial resolution enable local and mesoscale observations using the same data. This is a great advantage in situations where mesoscale measurements of radiation are needed, but only point measurements are available. A model describing cloud effects on net radiation can be calibrated using the net radiation point measurements and local cloud coverage measurements of the VIL. Subsequently, the VIL cloud coverage estimates can be used to estimate averaged net radiation over the scanning area of the VIL.
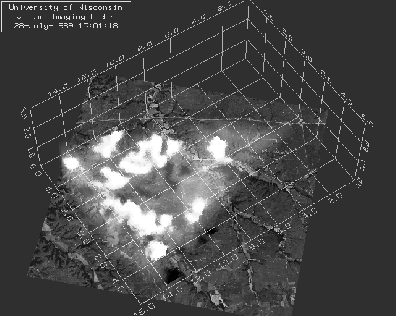
Figure 19: A three-dimensional aerosol distribution field
on July 28, 1989, at 15:01 CDT.
The VIL is located at the origin.
Ray tracing of the VIL backscatter data
provides a realistic view of the CBL.
The clouds appear white; cloud shadows appear dark.