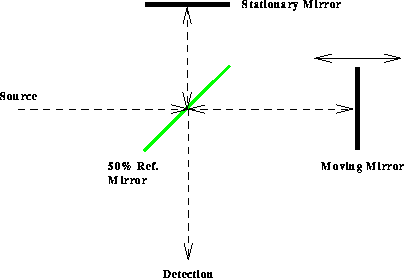
Figure 9: Schematic diagram of Michelson interferometer technique. It produces an interferogram which yields an atmospheric emission spectrum following Fourier transformation of the data. The radiation path is represented by the dashed lines.
Return to the Publications.
Return to the Index.
The Michelson interferometer produces an interferogram, the spectral summation of all interference patterns, which represents the Fourier transform of the atmospheric emission spectra. A schematic diagram of the Michelson interferometer is illustrated in Figure 9. The interferogram is produced by changing the phase of the incoming signal and combining this signal with a reference, stationary-phase, signal. This is accomplished by splitting the incident beam with a 50 percent reflective mirror into two paths. The first path utilizes a fixed mirror to return the signal to the splitter and serves as the phase reference. The second path has a mirror which is scanned continuously back and forth in two second intervals, changing the path length (and phase) of the beam, relative to the first. The two signals are recombined at the splitter to produce the interferogram.

Figure 9: Schematic diagram of Michelson interferometer technique. It produces
an interferogram which yields an atmospheric emission spectrum following
Fourier transformation of the data. The radiation path is represented by the
dashed lines.
The interferogram is monitored with a two-channel detection scheme, which uses a shortwave sensitive layer of indium antiminide (InSb) stacked in front of longwave sensitive mercury cadmium teluride (HgCdTe), cooled to 77 K with liquid nitrogen. This experiment utilized a liquid nitrogen dewar, which required refilling in 6-hour periods. An alternative option allows the use of a self-contained, mechanical Stirling cooler. This allows unassisted, continuous operation of the system under fair atmospheric conditions (Revercomb et al., 1996).