

Next: Conclusions
Up: Results and Discussion
Previous: Accuracy Analysis
Return to the Publications.
Return to the Index.
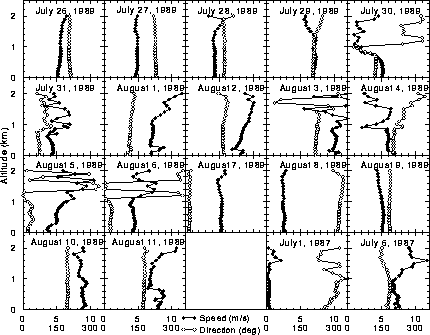
Figure 38 summarizes hourly wind profiles at noon
from 1987 and 1989 FIFE programs.
Each plot shows wind speed and direction as functions of altitude
from 12:00 to 13:00 CDT, except the plot on August 8, 1989, which represents
profiles from 11:00 to 12:00 CDT, and the plots on July 6, 1987, and
August 1,1989, which represent profiles from 13:00 to 14:00 CDT.
The profiles are consistent and smooth in the convective boundary layer.
Wide deviations at higher altitudes are generally due to
the lack of backscatter data when low clouds block the lidar
signal or lack of aerosol structures in the free atmosphere.
In strong convection, the aerosols rise up
several kilometers and the wind profiling is successful for
the chosen 2 km vertical range.
Wind profiles are not calculated higher than 2 km altitudes in this study,
since in most cases additional information is not gained.

Figure 38: Summary of hourly averaged, noon wind profiles from FIFE program.
Plots on July 6, 1987, and August 1, 1989, show profiles from
13:00 to 14:00 CDT.
Plot on August 8, 1989, shows profiles from 11:00 to 12:00 CDT.
All other plots represent profiles from 12:00 to 13:00 CDT.
Half-hourly averaged, quarter-hourly averaged, and 3-minute
wind profiles are also calculated.
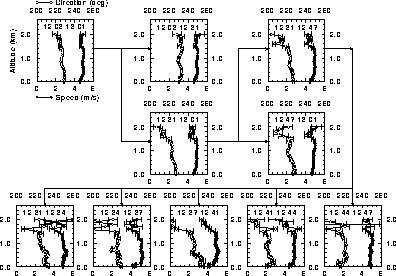
Figure 39 shows an example of wind profiles
with different averaging intervals on July 27, 1989.
The cloud base was at 1 km, cloud top
at 2 km, and cloud coverage 40%.
The hourly, half-hourly, and quarter-hourly averaged profiles
have negligible wind shear between 400 m and 1200 m.
Wind speed decreases close to ground due to surface friction.
The 3-minute wind profiles show fluctuations above 1.4 km, since
clouds partly blocked the scan.
When averaging time increases, the fluctuations decrease and
the wind profiles become smoother.
The 3-minute profiles have instabilities in wind speed and direction
near 600 m.
The RMS error estimates suggest these are
due to real atmospheric phenomena.

Figure 39: Hourly, half-hourly, quarter-hourly, and 3-minute wind profiles
on July 27, 1989, from 12:00 to 13:00 CDT.
Error bars show RMS errors of the estimates.


Next: Conclusions
Up: Results and Discussion
Previous: Accuracy Analysis
Return to the Publications.
Return to the Index.
Antti Piironen
Tue Mar 26 20:53:05 CST 1996


