


A problem of the wind profiling method is the possibility that the selected maximum correlation region results from random noise correlations instead of aerosol structure correlations. Normally, a cross correlation function between two CAPPI scans is dominated by a single peak. Sometimes, however, random noise fluctuations and a weak aerosol structure coherence between subsequent CAPPI scans lead to random correlation regions, which are stronger than the aerosol correlation peak. Then the wind estimate may be calculated from the strongest random correlation region, which causes a random result. This prompts a need to identify the spurious correlation peaks.
An earlier study[44] indicated
the intensity of wind estimate fluctuations from the hourly mean values
correlated with the CCF maximum strength.
In this study, an objective method is developed
to distinguish between reliable and unreliable wind estimates by
indicating the probability that the chosen maximum
correlation region represents the mean aerosol movements.
Probability  that the strongest region of the CCF
represents the mean wind is given by
that the strongest region of the CCF
represents the mean wind is given by
where  is the mass of the global maximum
correlation region and
is the mass of the global maximum
correlation region and  is the mass of the correlation region i.
The masses are calculated by summing the
intensities around the peak with amplitudes
higher than
is the mass of the correlation region i.
The masses are calculated by summing the
intensities around the peak with amplitudes
higher than  of the global maximum correlation amplitude.
If there is only one correlation region, then  is 1.
If there are numerous similar correlation regions, then
is 1.
If there are numerous similar correlation regions, then
 tends to zero.
Figure 29
shows scatter plots for  vs. wind speed and direction
for quarter-hourly averaged results on July 27, 1989.
Most of the results have a
vs. wind speed and direction
for quarter-hourly averaged results on July 27, 1989.
Most of the results have a  and are
within the natural wind deviation of that day;
the results with
and are
within the natural wind deviation of that day;
the results with  are more widely spread.
In general, a
are more widely spread.
In general, a  provides good results, while
a
provides good results, while
a  < 0.5 is poor.
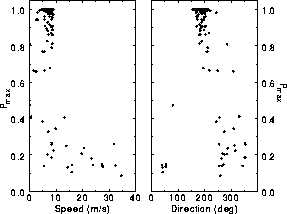
Figure 29:  vs. speed (left) and direction (right) for
quarter-hourly averaged wind estimates on July 27, 1989,
from 8:00 to 15:00 CDT.
All measurements with
vs. speed (left) and direction (right) for
quarter-hourly averaged wind estimates on July 27, 1989,
from 8:00 to 15:00 CDT.
All measurements with  are within natural deviation
of the wind; the most widely fluctuating wind results have
are within natural deviation
of the wind; the most widely fluctuating wind results have
 .
.
Figure 30 shows the fraction of reliable VIL wind estimates
as a function of averaging time interval and  .
Averaging the cross correlation functions effectively increases
the fraction of reliable results.
When compared with the individual measurements without time-averaging,
even a fifteen-minute averaging more than doubles
the ratio of the good measurements to all measurements.
About 76% of the hourly averaged wind estimates in the boundary layer
are calculated from a unique correlation maximum region.
Note that most of the measurements with
.
Averaging the cross correlation functions effectively increases
the fraction of reliable results.
When compared with the individual measurements without time-averaging,
even a fifteen-minute averaging more than doubles
the ratio of the good measurements to all measurements.
About 76% of the hourly averaged wind estimates in the boundary layer
are calculated from a unique correlation maximum region.
Note that most of the measurements with  between 0.9 and 1.0 are
consistent.
between 0.9 and 1.0 are
consistent.
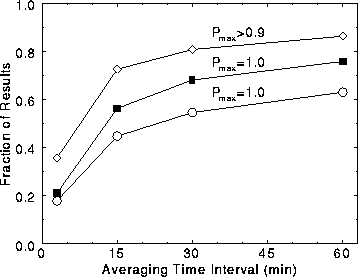
Figure 30: Fraction of reliable results
as a function of averaging time interval and  from July 26 to August 11, 1989.
Open circles show fraction of results with
from July 26 to August 11, 1989.
Open circles show fraction of results with  and altitudes ranging from 50 m to 2000 m;
black rectangles show measurements in the convective boundary layer
with
and altitudes ranging from 50 m to 2000 m;
black rectangles show measurements in the convective boundary layer
with  ;
open diamonds show measurements in the convective boundary layer
with
;
open diamonds show measurements in the convective boundary layer
with  .
Averaging the CCF increases the fraction of reliable results
by reducing random correlations.
.
Averaging the CCF increases the fraction of reliable results
by reducing random correlations.
