


Figure 28 summarizes the wind estimation scheme. First, subsequent CAPPI scans are formed and filtered. Then, a temporal median scan is formed and subtracted from the CAPPI scans to remove static aerosol structures. The CAPPI scans are then histogram equalized to prevent single aerosol structures from dominating the CAPPI scans. Finally, two-dimensional cross correlation functions are calculated and temporally averaged. The temporal averaging of the CCF suppresses random noise correlations.
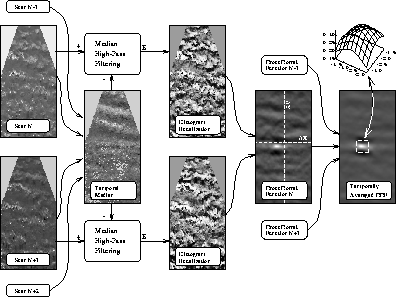
Figure 28: Two subsequent CAPPI planes (leftmost),
a temporal median of subsequent CAPPI scans (second left),
histogram equalized CAPPI scans (middle),
a cross correlation function between
the CAPPI scans (second right), and a temporally averaged CCF (rightmost).
The wire frame graph in the top-right corner shows the smooth CCF maximum
peak in detail; the axes represent the distance from origin in ms .
The temporal median picture shows steady structures
across the scan.
Histogram equalization normalizes aerosol structures to the same amplitude
scale.
Averaging of the CCF reduces noise induced correlations.
.
The temporal median picture shows steady structures
across the scan.
Histogram equalization normalizes aerosol structures to the same amplitude
scale.
Averaging of the CCF reduces noise induced correlations.
The wind estimate is calculated from the correlation function in three steps. 1) The global maximum peak is located. 2) The top of the global maximum is determined by least-square fitting a quadratic polynomial function to the surrounding of the top. 3) Wind speed is calculated from the location of the maximum of the quadratic polynomial function.