Return to the Index.

AHSRL backscatter image of forest fire smoke obtained on
June 28 and 29 of 2004.

AHSRL backscatter and depolarization images obtained during the
12-June-04 13:00 UTC ICESAT overpass of Madison, WI. ICE-sat was
commanded to point directly at our laboratory to enable comparisons
between the satellite lidar and the AHSRL. Dense stratus clouds with a base
altitude of less than 100m covered our site during the overpass. Click on image to enlarge.

AHSRL backscatter and depolarization images obtained during the
18-mar-04 09:05 UTC ICESAT overpass of Madison, WI. ICE-sat was
commanded to point directly at our laboratory to enable comparisons
between the satellite lidar and the AHSRL. Dense stratus clouds with ice
crystal virga below covered our site during the overpass. Click on image to enlarge.

Backscatter cross section between 8:30 and 9:30 UT.

Optical depth profile averaged from 8:30 to 9:30 UT. Measured optical depth
of OD=4 is at the penetration limit of the instrument.

AHSRL backscatter and depolarization images obtained during the
13-mar-04 20:44 UTC ICESAT overpass of Madison, WI. ICE-sat was
commanded to point directly at our laboratory to enable comparisons
between the satellite lidar and the AHSRL. Dense stratus clouds covered our site during the overpass. Click on image to enlarge.

Backscatter and depolarization for the two-hour period around the 13-Mar-04 ICESAT overpass of Madison, WI.

Backscatter and depolarization for the 4-minute period around the 13-Mar-04 ICESAT overpass of Madison, WI.

HSRL measured optical depth profile for the 4-minute period around the
13-Mar-04 ICESAT overpass of Madison, WI.

An attenuated backscatter image observed with the combined channel of
the AHSRL on 14-Jan-04. A well calibrated conventional lidar
would produce an identical image. Notice how the
cirrus cloud at 7km by is shadowed by 3.4km water cloud which appears at
6:10 UTC. Also notice the strong lidar return seen below the clouds as
a result of the combined effect of aerosol and molecular
scattering. Data gaps at 8 and 12 UTC occur during system calibrations.
The calibration sequences will be shortened in the future. (click on image to enlarge)

The backscatter cross section image computed for the 14-Jan-04 data
shown above. This image is absolutely calibrated and molecular
scattering has been removed. Areas with insufficient signal for the
HSRL inversion are indicated by black shadows; everywhere else
attenuation has been removed. Notice the effect of attenuation
correction on the appearance of 7km cirrus cloud and the increased contrast
in aerosol layers due to the removal of the molecular scattering.

The circular depolarization image for the 14-Jan-04 case shown
above. Water clouds produce little depolarizations and appear blue in
this logrithmic display. Ice crystals produce large depolarizations
allowing easy identification of both cirrus clouds and ice crystal
virga which appear red in this image. An insturment bias is evident in
regions of small backscatter cross section where the measured
depolarizations are slightly too large(eg. in the boundary aerosol layer
before 10 UTC). Laser light scattered inside of the instrument seems
to be responsible. Corrective measures are underway.

The average backscatter cross section profiles measured between 6:15 and 7:15 UTC for the data shown above.
The black profile is the Rayleigh scattering cross section computed from the radiosonde profile. The measured
attenuated Rayleigh backscatter cross section is shown in blue and the measured particulate backscatter cross section is shown in red. Notice that even though the images do not show penetration through the upper level
cirrus, these time averages have no trouble penetrating the upper cloud.

The optical depth profile measured between 6:15 and 7:15 UTC for the data shown above. Blue and red symbols show
150 m and 600 m vertical averages respectively. The water cloud at 3.8k m has an optical depth of 0.5 while the
cirrus cloud with a base at 4.8 km has an optical depth of 2.1.

A 1 minute average optical depth profile measured in a denser portion
of the cloud between 6:40 and 6:41 UTC for the data shown above. Blue
and red symbols show 150 m and 600 m vertical averages
respectively. The water cloud at 3.8k m has an optical depth of 0.3
while an optical depth of ~2.6 is measured in the cirrus cloud. Notice
that even with this short time average, the measurement extends
through the entire cirrus cloud. This is right at the limit for such a
short time average. With longer averages, systematic errors and noise
other than photon statistics produce a limit to optical depth
measurements at ~4. Further system improvements may increase this
limit slightly.

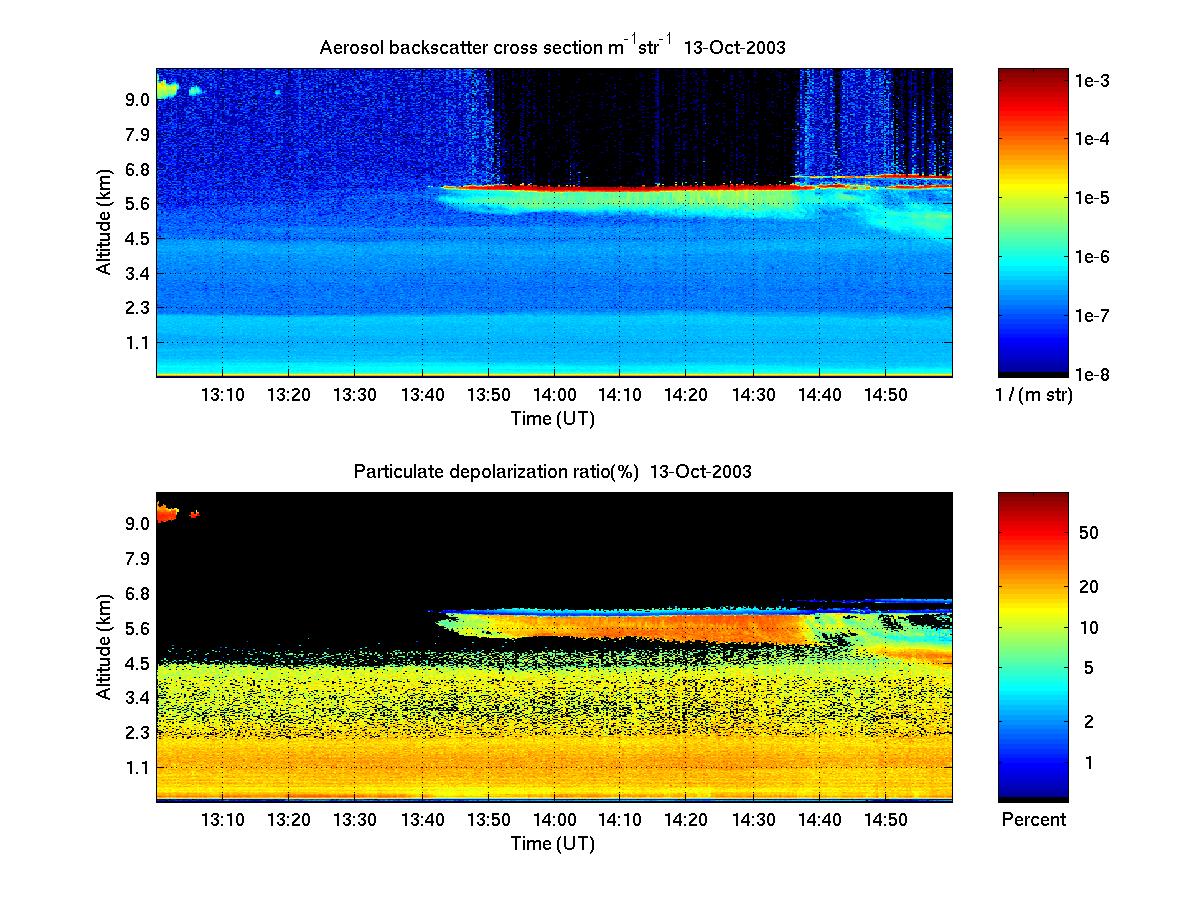
AHSRL backscatter and depolarization images obtained during the 13-Oct-03 14:09 UTC ICESAT overpass of Madison, WI. ICE-sat was commanded to point directly at our laboratory to enable comparisons between the satellite lidar and the AHSRL. A thin layer of alto-stratus clouds covered our site during the overpass.

Backscatter and depolarization for the two-hour period around the 13-Oct-03 ICESAT overpass of Madison, WI.
Backscatter and depolarization for the 20-minute period around the 13-Oct-03 ICESAT overpass of Madison, WI.

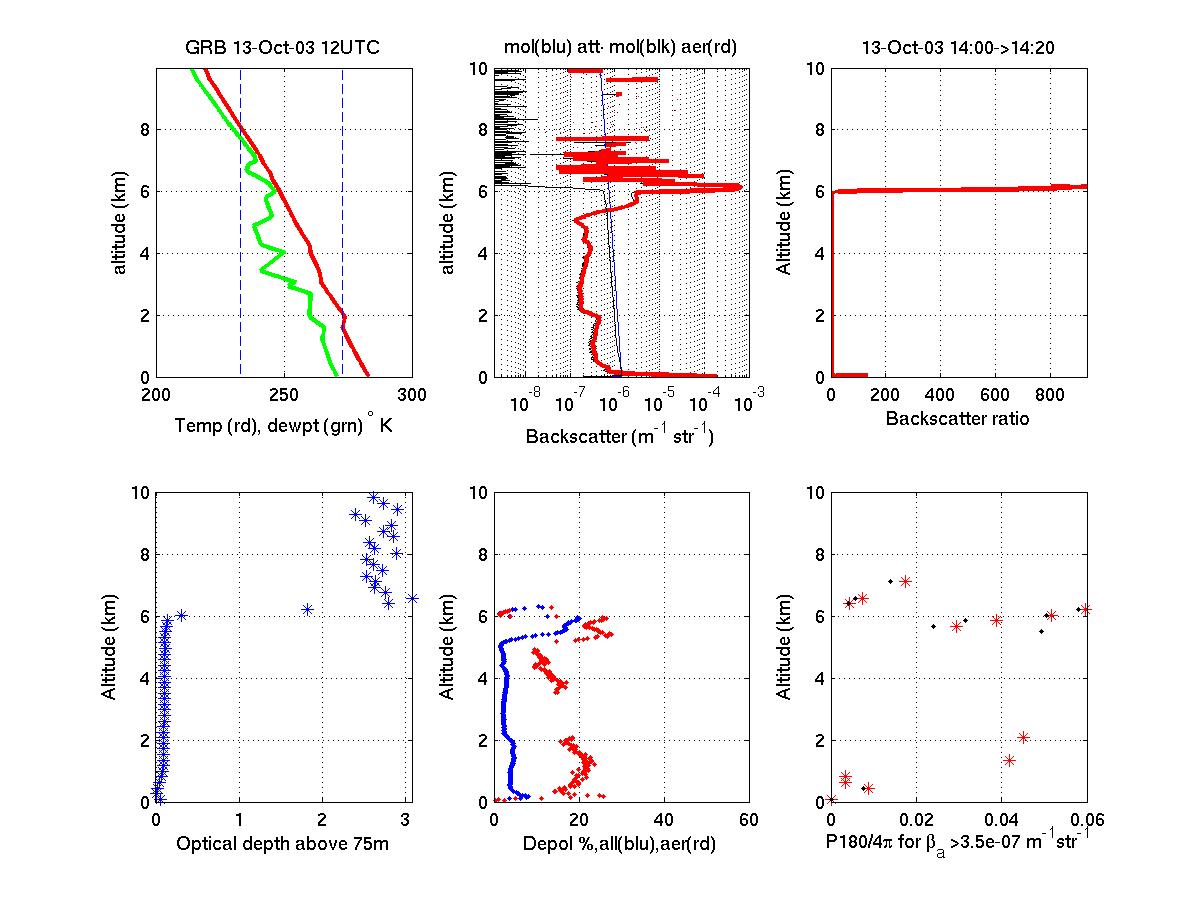
HSRL measured average profiles for the 20-minute period around the 13-Oct-03 ICESAT overpass of Madison, WI.

AHSRL backscatter and depolarization images obtained during the 9-Oct-03 1:45 UTC ICESAT overpass of Madison, WI. ICE-sat was commanded to point directly at our laboratory to enable comparisons between the satellite lidar and the AHSRL.
MPEG4 MOVIE
A MPEG 4 movie(5.6 mbyte) prepared by Igor
Razenkov showing the ICE-sat overpass. The movie shows both the AHSRL beam
and three pulses from the ICE-sat laser.
A higher resolution copy of the movie(15 mbyte) You may need to increase the brightness via the video control on your viewing software in order to see the AHSRL beam clearly.
ICEsat image
 ICEsat 1064 nm lidar image observed during the Oct 9th overpass of Madison, WI. The vertical red
line is located over Madison. Notice that the altitude scale is offset because the lidar was pointed off-nadir to aim at Madison.
ICEsat 1064 nm lidar image observed during the Oct 9th overpass of Madison, WI. The vertical red
line is located over Madison. Notice that the altitude scale is offset because the lidar was pointed off-nadir to aim at Madison.

Measurements of the backscatter cross section (upper panel) and
depolarization (lower panel) are shown during a weak cold front
passage (click on image for expanded view). Particulate and molecular
backscattering have been sepearted; these images show only the
particulate component. The leading edge of the front cold passed
overhead at approximately 12:30 UTC. Water clouds are seen above the
leading edge of the front (z=2.2 km around 12:30UTC) and at the top of
the afternoon boundary layer (z~2km after 20:45 UTC). Water clouds can
be identified by the presence of strong backscatter(red areas) with
very small depolarizations (dark blue areas). The leading edge of the
cold front (z~0.8 km after 12:30 UTC) is much cleaner than the
surrounding air, Automatic system calibrations
produce data gaps (vertical black strips). The frequency and durration
of calibrations will be decreased as we gain more operation experience
with this lidar.

Modis image of Wisconsin obtained between 16:32-16:45 UTC (click on
image for expanded view). The clouds associated with the front (z~2.2 km around 12:30 UTC in the above picture) are now well south-east of Madison.
Return to the Index.
eloranta@lidar.ssec.wisc.edu


 ICEsat 1064 nm lidar image observed during the Oct 9th overpass of Madison, WI. The vertical red
line is located over Madison. Notice that the altitude scale is offset because the lidar was pointed off-nadir to aim at Madison.
ICEsat 1064 nm lidar image observed during the Oct 9th overpass of Madison, WI. The vertical red
line is located over Madison. Notice that the altitude scale is offset because the lidar was pointed off-nadir to aim at Madison.

