Large-Eddy Simulation #266: (Upwind)
LES RUN #266: Exactly same as #263 except hdkr=vdkr=0.15.
This is an upwind simulation with albedo=0.66
in order to have temperature increase at 7.5 m AGL of 0.8 degrees
per hour.
200 x 120 x 69 with 15-m resolution in all 3 directions.
Periodic lateral boundary conditions.
Entire domain over snow-covered land.
Horizontally homogeneous initial condition according to observations
from ISS2 on 13 Jan 98 at 16:30 Z.
The initial temperature and dew-point profile was from the radiosonde and the
initial wind speed and direction profiles were from
linear fits to the data as shown in the first frame
of the animation (the thumbnail is the last frame of the animation.)
Click here
to see the NMSTASK file of LES #266.
The following animation shows the
evolution of mean profiles (red lines) of wind speed, direction,
temperature and dewpoint as well as vertical velocity
on a east-west oriented vertical slice.


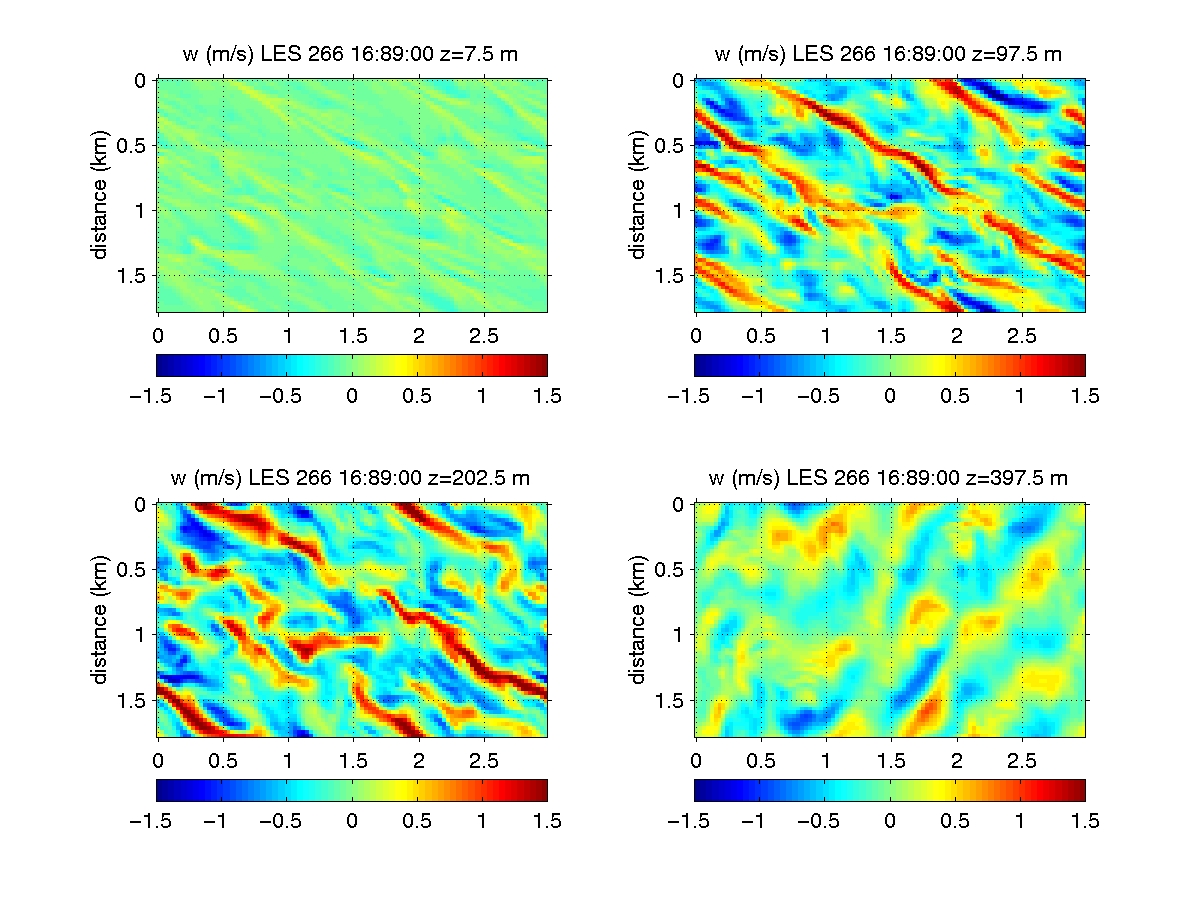
The following animation shows vertical velocity on 4 horizontal
slices: 7.5, 97.5, 202.5 and 397.5 m above the surface.

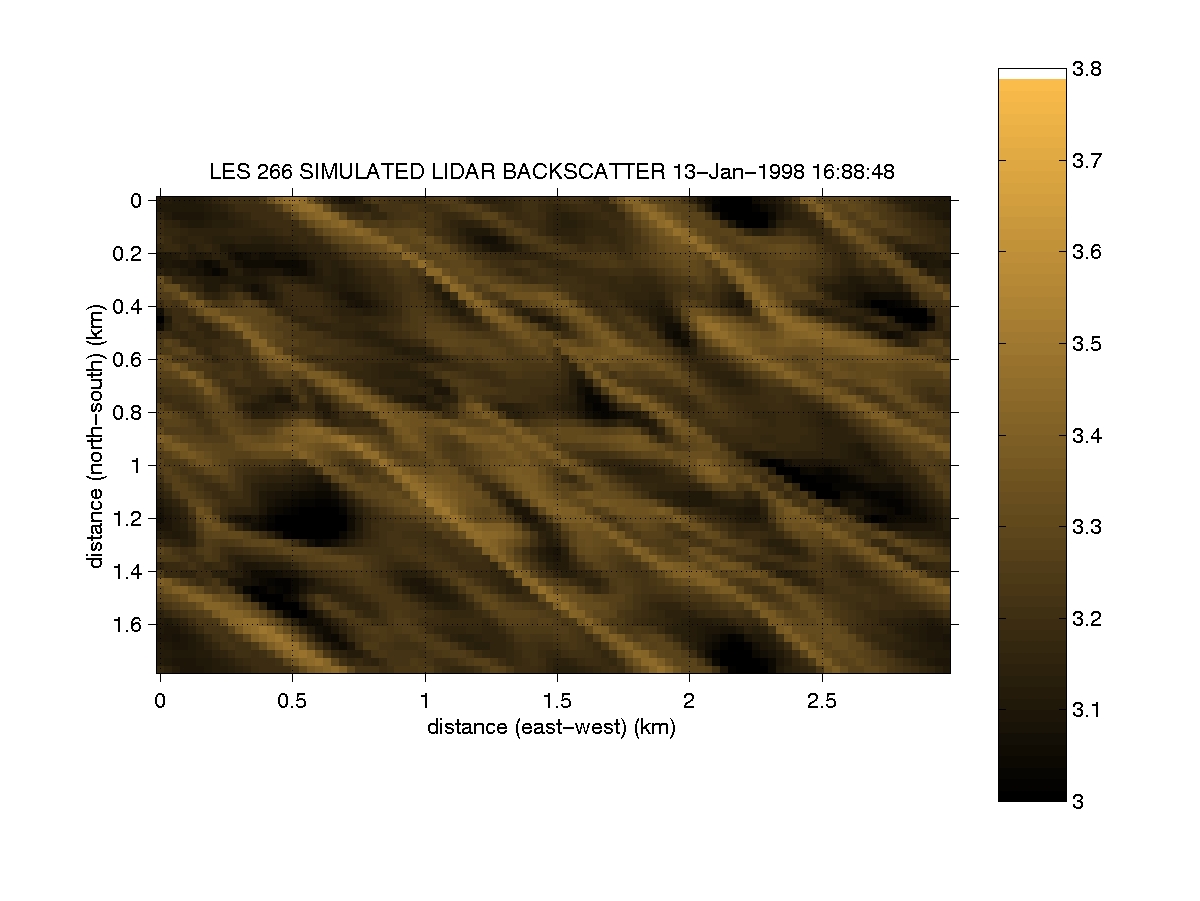
The following animation shows simulated lidar aerosol backscatter
at 7.5 m above the surface.

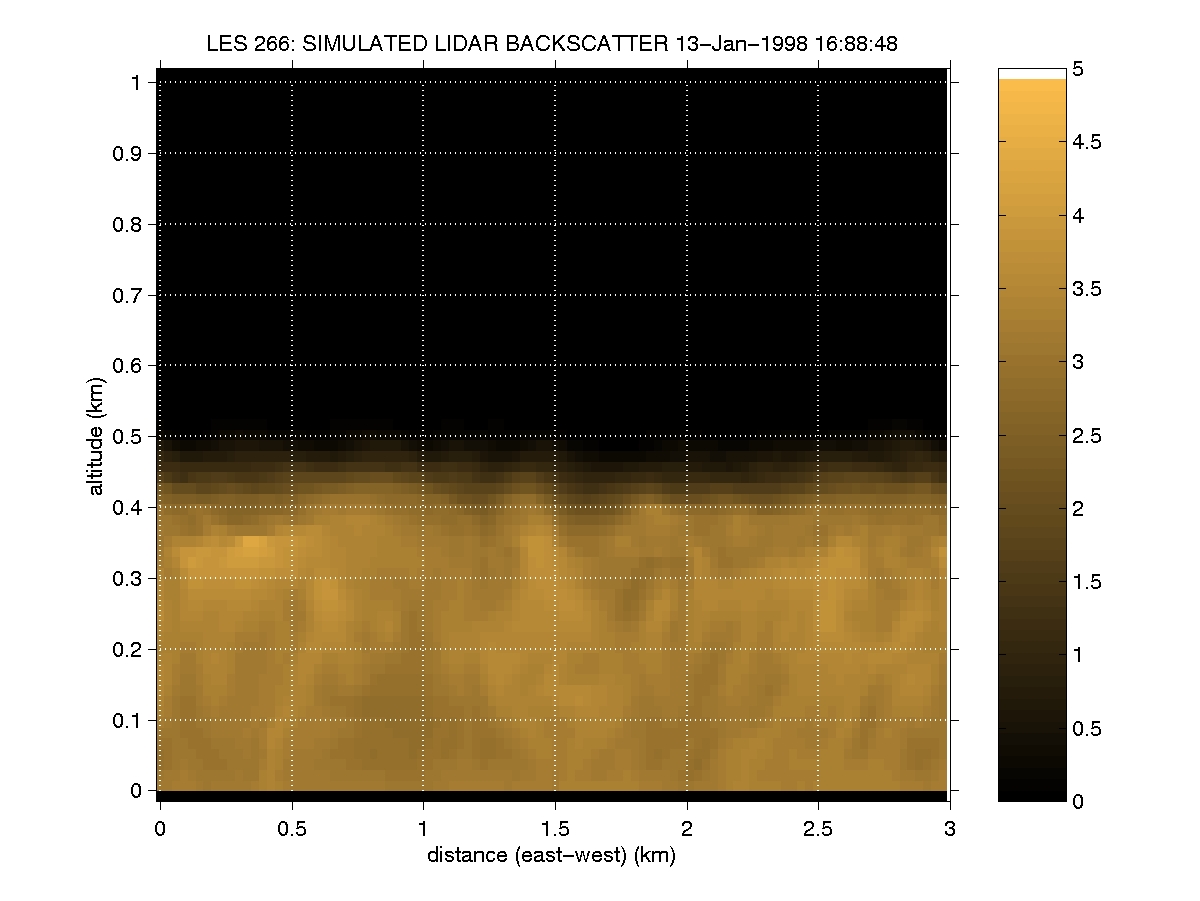
The following animation shows simulated lidar aerosol backscatter
on an east-west vertical slice through the model domain.

UW Lidar // March, 2001 // root@lidar.ssec.wisc.edu
Return to the
 Index
Index