Large-Eddy Simulation #260: (IBL)
LES RUN #260: Internal boundary layer on 13 Jan 98 initialized
with the 30-minute solution to LES#252 by east-west replication.
Flow recycler turned on. Span-wise slice to extract perturbations
at 3 km downstream of the west wall. This simulation is same as
#256 except passive tracer inflow condition on west wall fixed and
the IBL part of the simulation run out to 1-hour.
Click here
to see the NMSTASK file of LES #260.
The following animation shows simulated lidar backscatter
from the shore to 5.64 km offshore. This is only the domain which
lies over the lake and about the same area as shown in the lidar PPI scans.
The domain has been replicated once in the north-south direction to assist your
eye in following coherent structures across the domain.


The following animation shows simulated lidar backscatter over land
part of the domain only. This is the region immediately upwind of the IBL.
The domain has been replicated once in the
north-south direction to assist your eye in following coherent structures
across the domain. The clearing that occurs at the end of the movie
was produced by a bug in the passive tracer boundary condition on the
west wall and has been fixed. The north-south vertical slice from which
perturbations are extracted for adding to the west wall is located at
3 km.

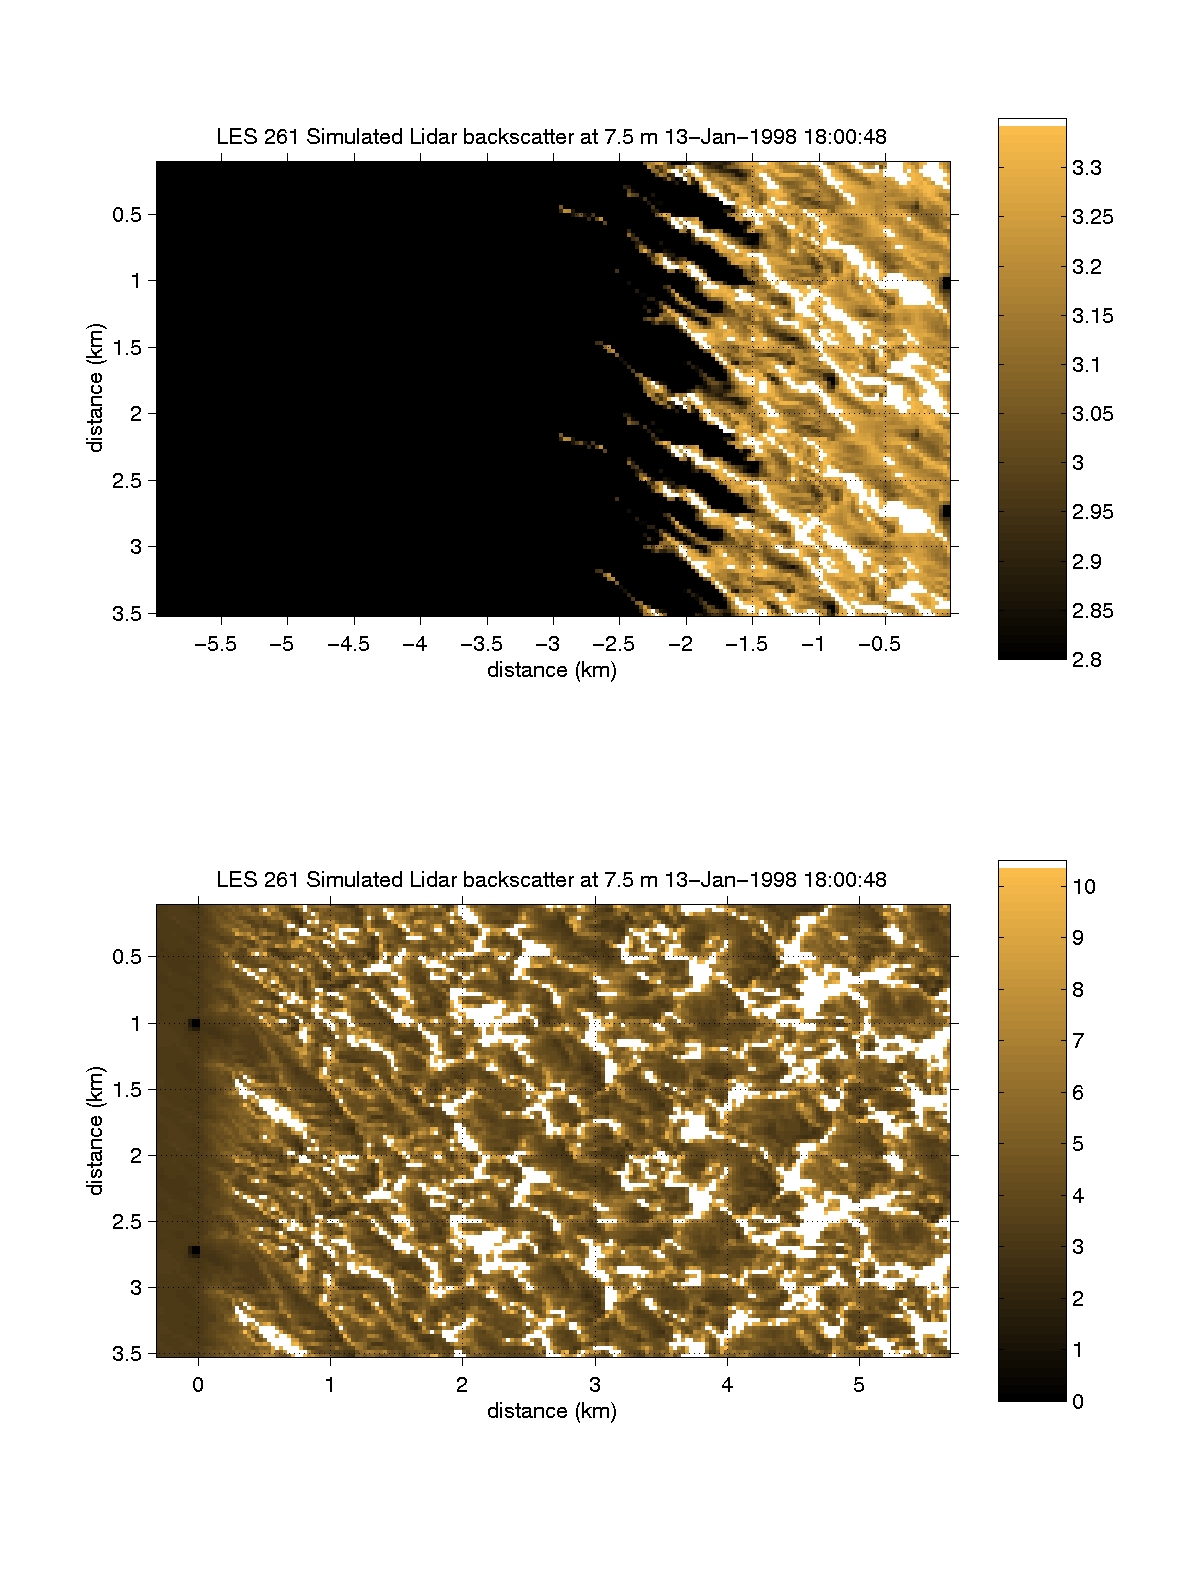
The following animation shows simulated lidar backscatter over land in
the top-panel and over water in the bottom panel.


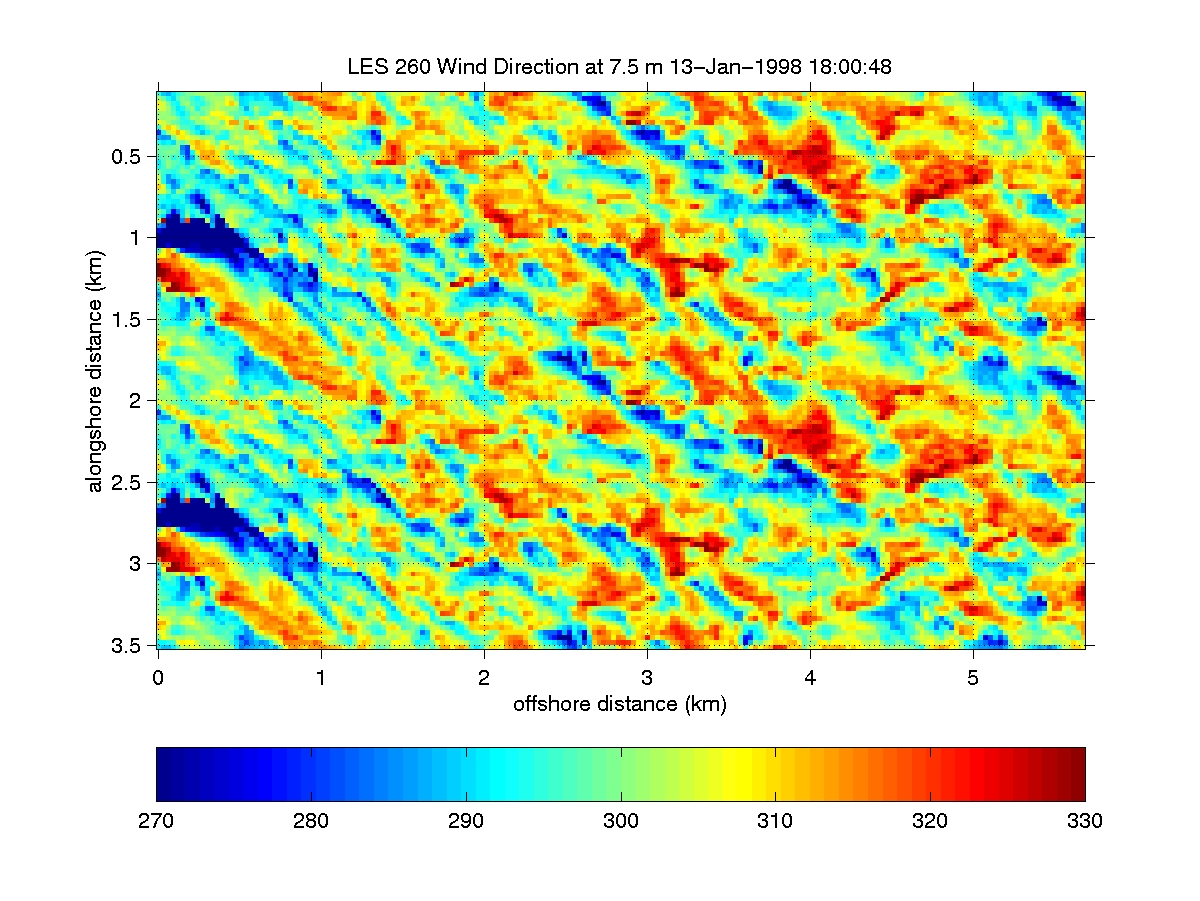
The following animation shows simulated wind direction
from the shore to 5.64 km offshore. This is only the domain which
lies over the lake and about the same area as shown in the lidar PPI scans.
The domain has been replicated once in the north-south direction to assist your
eye in following coherent structures across the domain.

The following animation shows simulated wind speed
from the shore to 5.64 km offshore. This is only the domain which
lies over the lake and about the same area as shown in the lidar PPI scans.
The domain has been replicated once in the north-south direction to assist your
eye in following coherent structures across the domain.

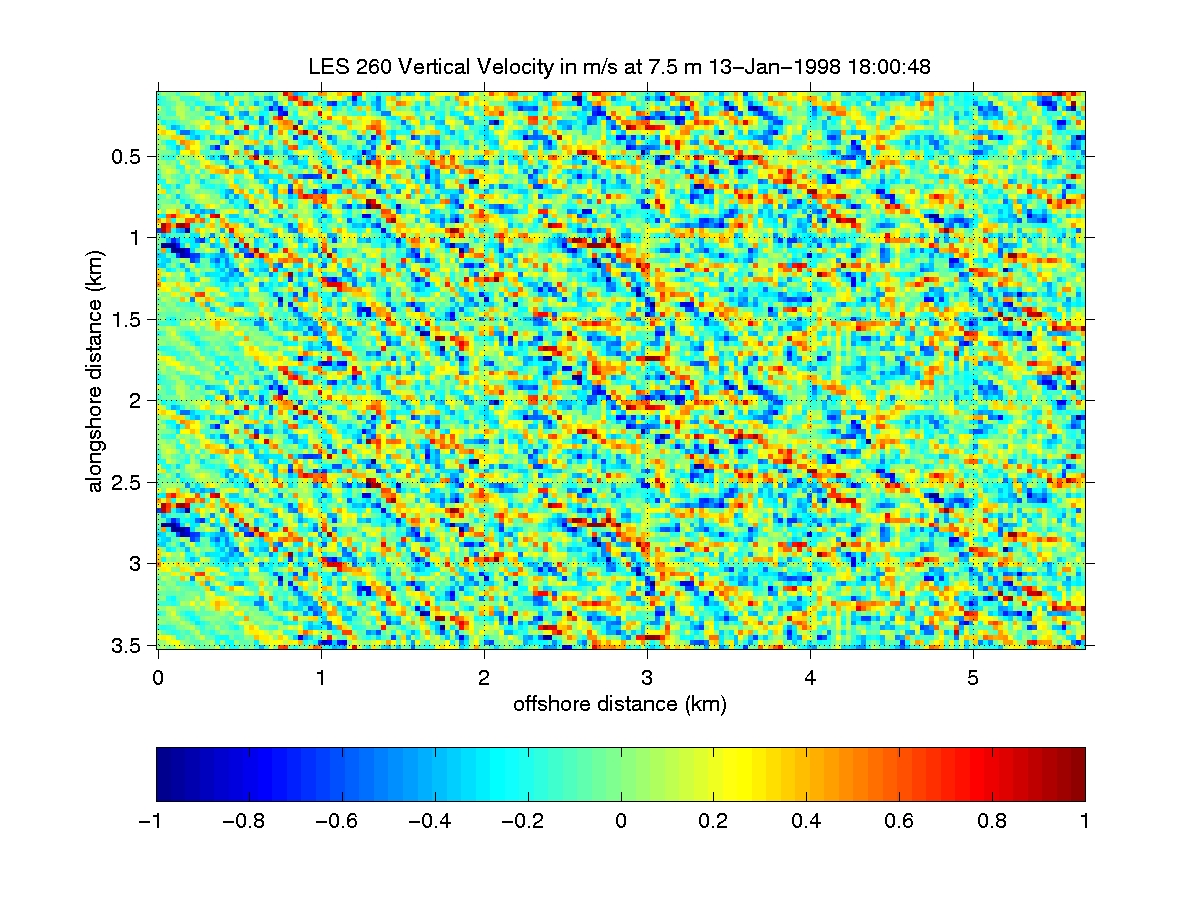
The following animation shows simulated vertical velocity
from the shore to 5.64 km offshore. This is only the domain which
lies over the lake and about the same area as shown in the lidar PPI scans.
The domain has been replicated once in the north-south direction to assist your
eye in following coherent structures across the domain.

The following animation shows vertical velocity on a horizontal
slice 7.5 m above the surface. The first 150 frames (30-minutes)
are from LES#252 and show spin-up of the smaller domain. The
subsequent frames are all from LES#260 which is the 6.6
million grid point domain. LES#260 is started by taking the perturbations
at 1800s in #252 and replicating them 4 times across the larger domain.

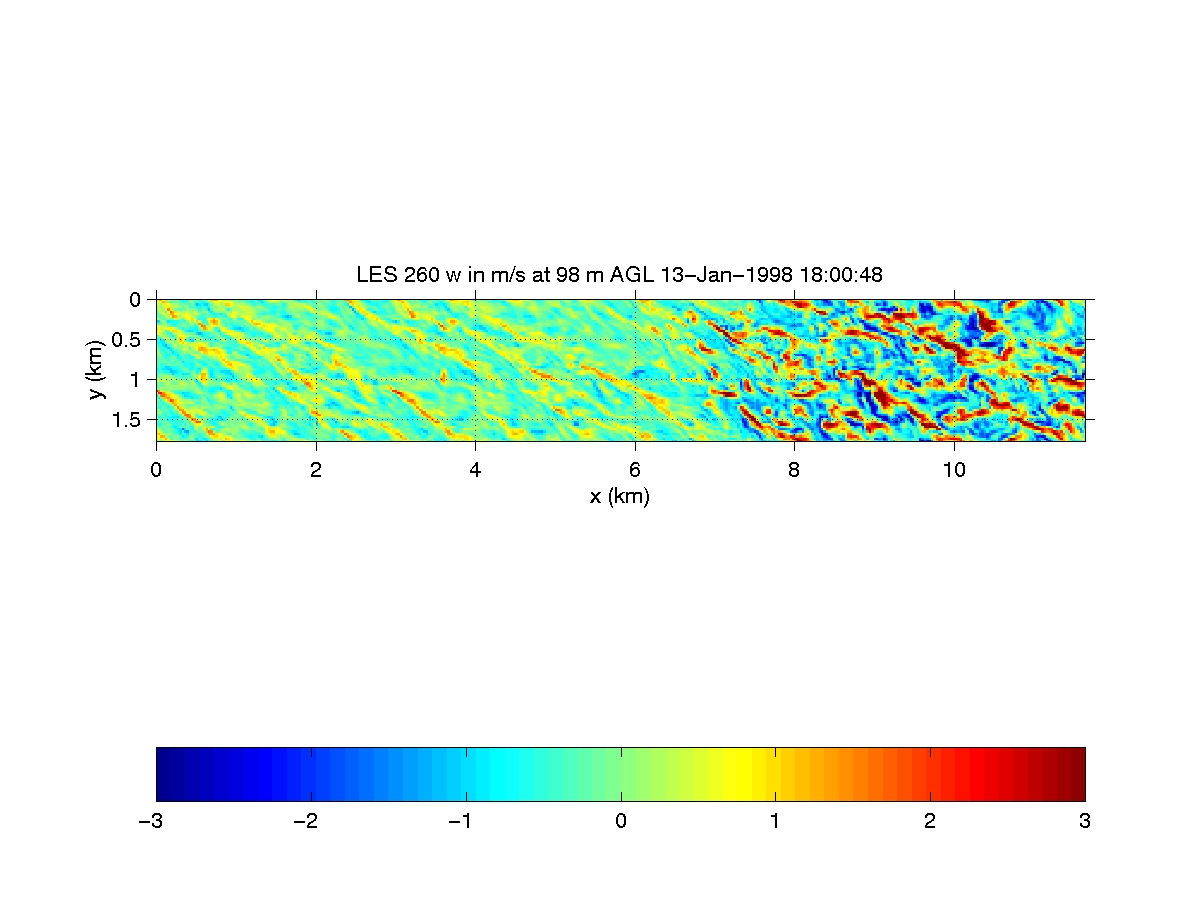
The following animation shows vertical velocity on a horizontal
slice 98 m above the surface.

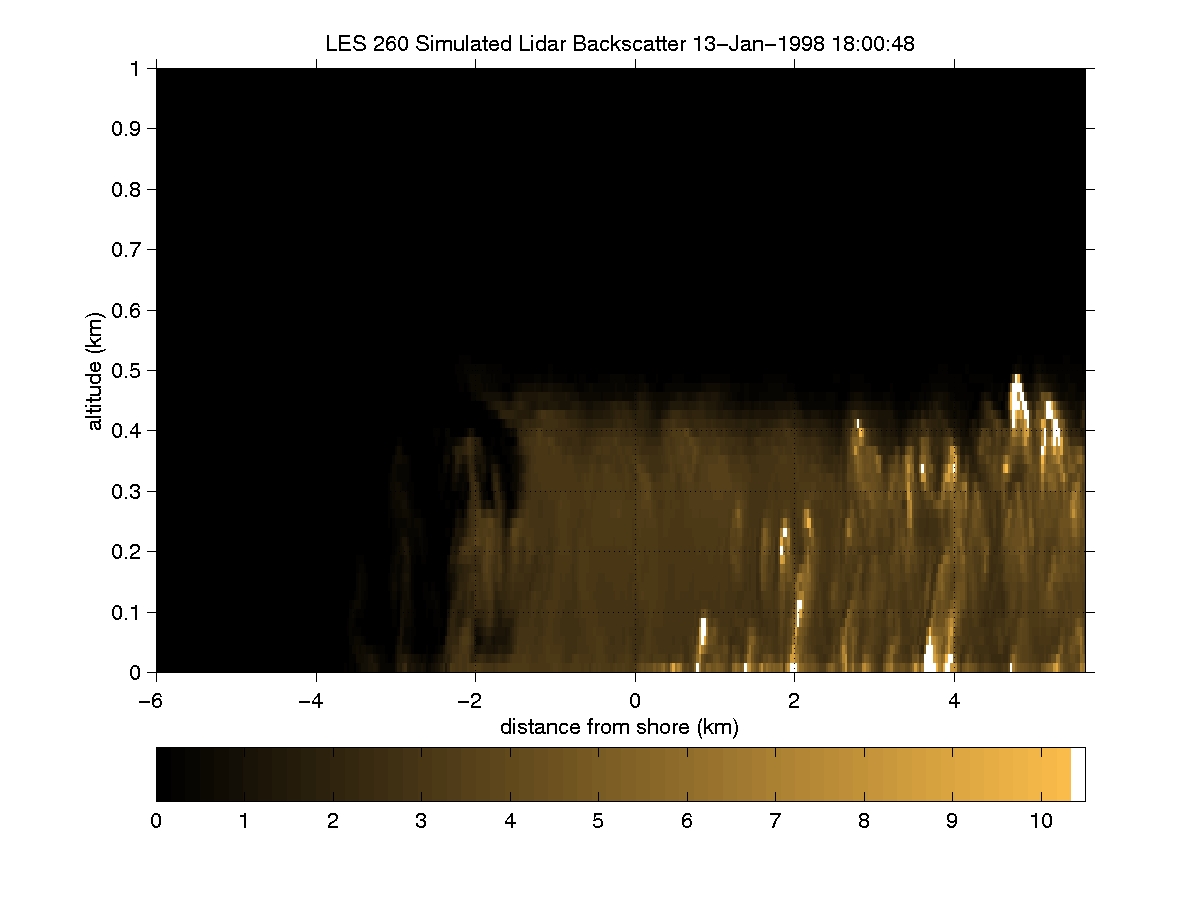
The following animation shows simulated lidar backscatter on an east-west vertical
slice. The clearing that moves from west to east during the last part of
the animation is caused by lack of passive tracer on the inflow wall after
resuming the simulation after the hard-disk filled up.
This problem will be fixed in future simulations.

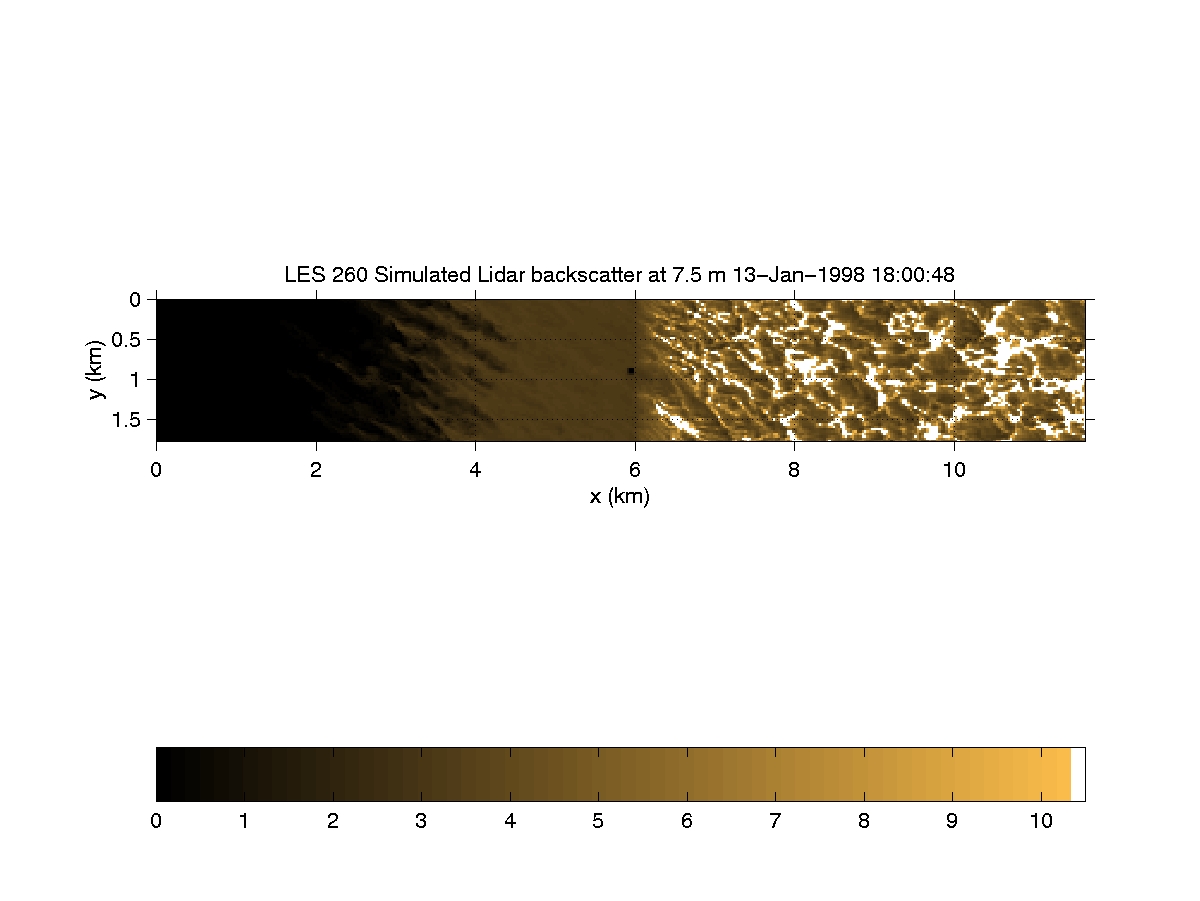
The following animation shows simulated aerosol backscatter on a horizontal
slice 7.5 m above the surface. The first 150 frames (30-minutes) are
from LES#252 and show spin-up of the smaller domain. The subsequent frames
are all from LES#260. The clearing that moves from west to east during the
last part of the animation is caused by lack of passive tracer on the inflow
wall after resuming the simulation after the hard-disk filled up.
This problem will be fixed in future simulations.

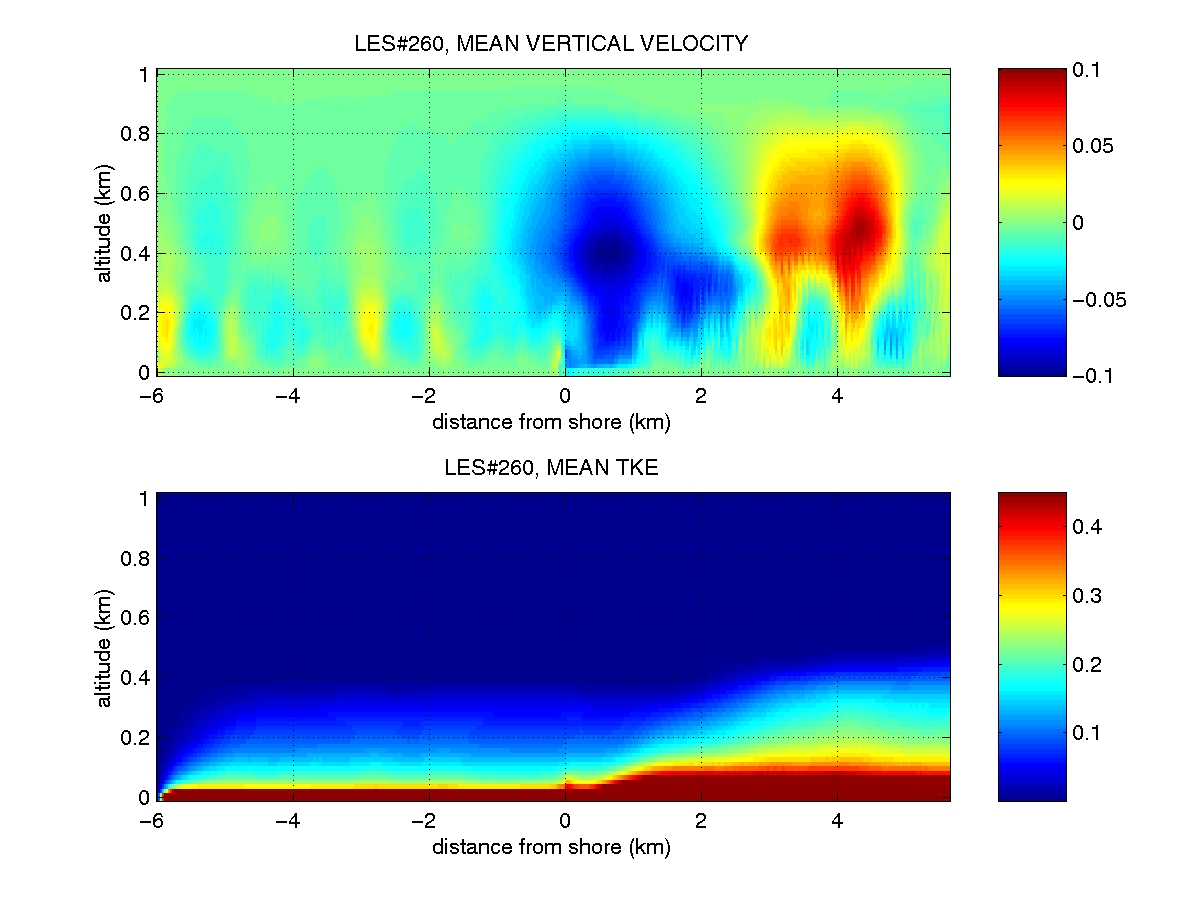
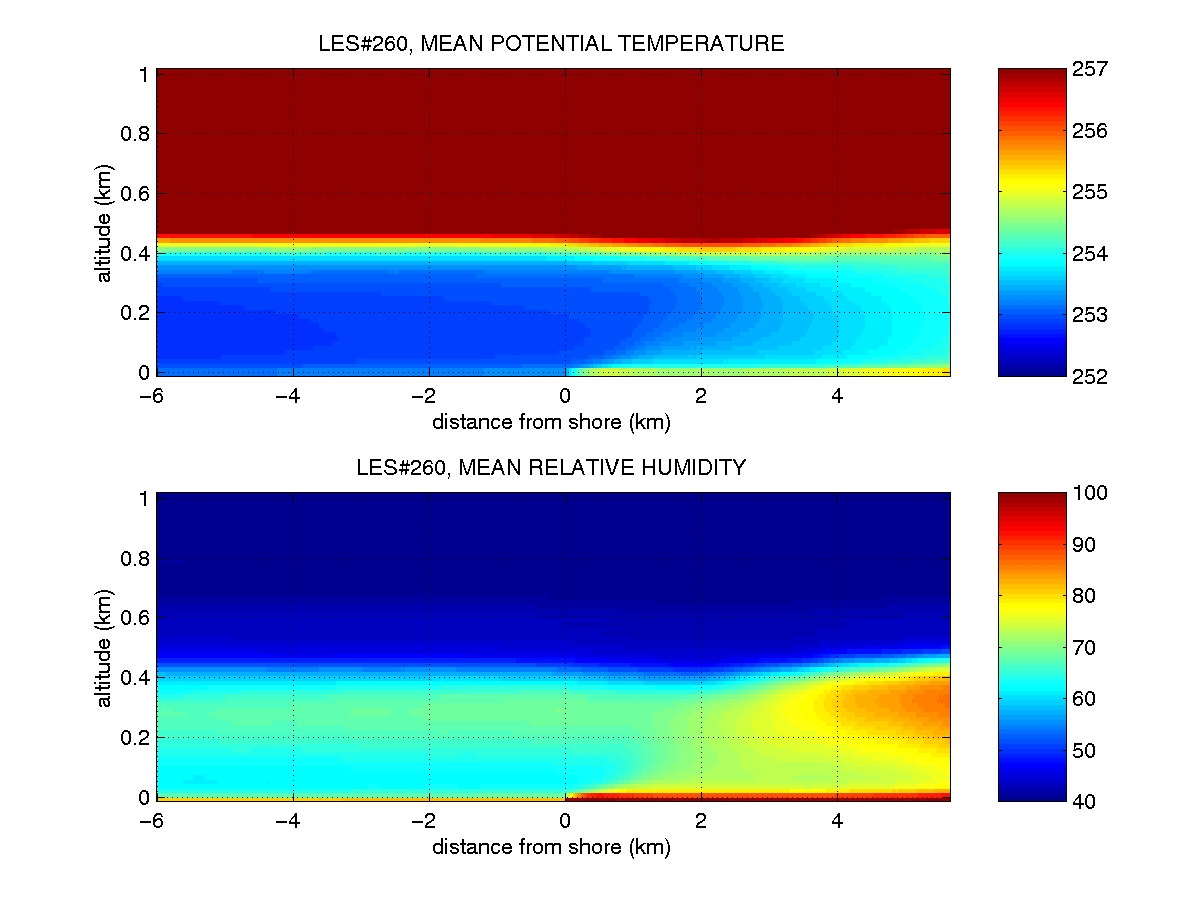
The images below show some mean properties of the simulation.
The means were computed over north-south oriented rows at
all altitudes and downwind distances and over a 31-minute period.


UW Lidar // Jan 8, 2001 // root@lidar.ssec.wisc.edu
Return to the
 Index
Index