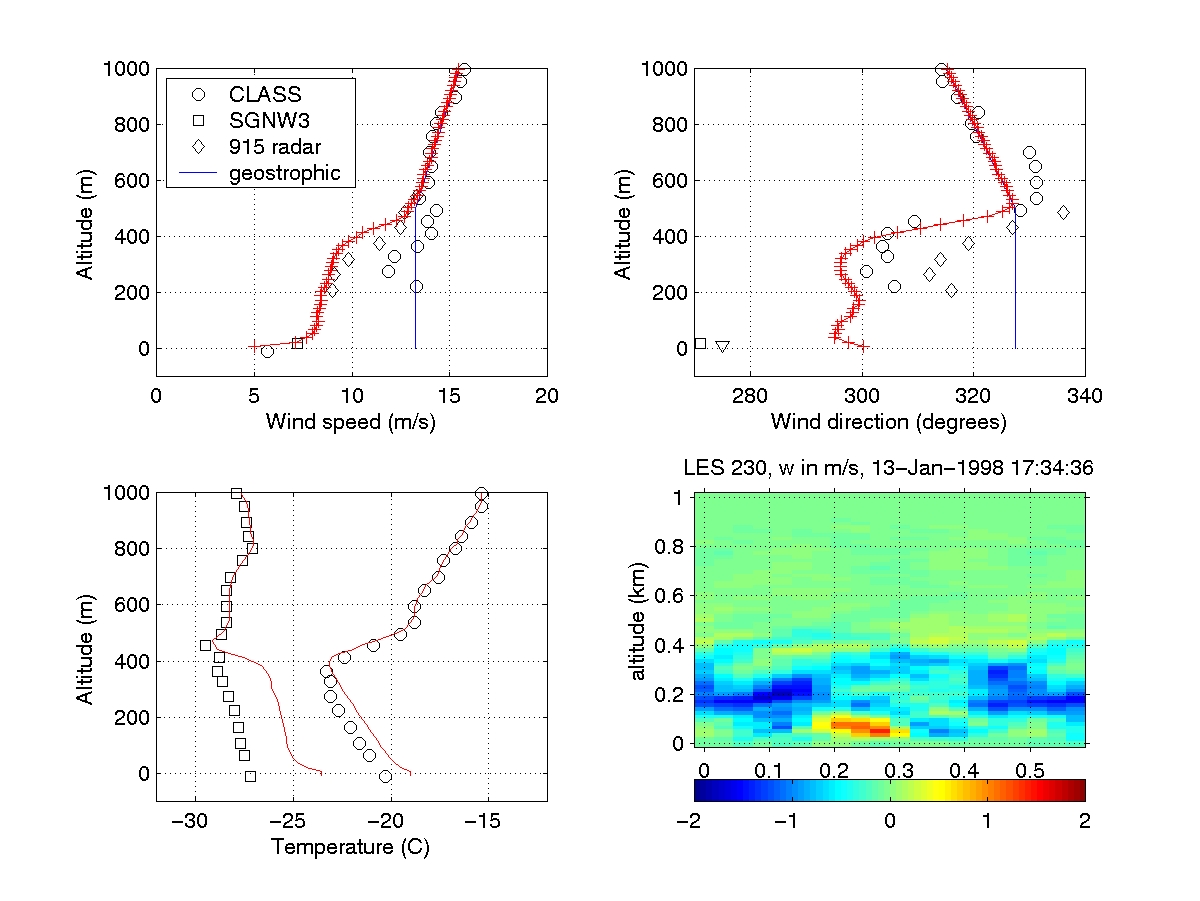
Large-Eddy Simulations #230 & 231: (Upwind)
LES RUN #230 and 231: Upwind simulations to test effect
of turning Coriolis off. #230 has Coriolis on and #231 has Coriolis off.
Both simulations have 40 x 40 x 69 domains, dx=dy=dz=15 m,
Periodic lateral boundary conditions.
Entire domain over snow-covered land.
Arakawa & Lamb advection routine, VDKR=HDKR=0.05.
Horizontally homogeneous initial condition according to observations.
The initial temperature and dew-point profile was from the radiosonde and the
initial wind speed and direction profiles were from
linear fits to the data as shown in the first frame
of the animation (the thumbnail is the last frame of the animation.)
LES#230
The following animation shows the
evolution of mean profiles (red lines) of wind speed, direction,
temperature and dewpoint as well as vertical velocity
on a east-west oriented vertical slice.


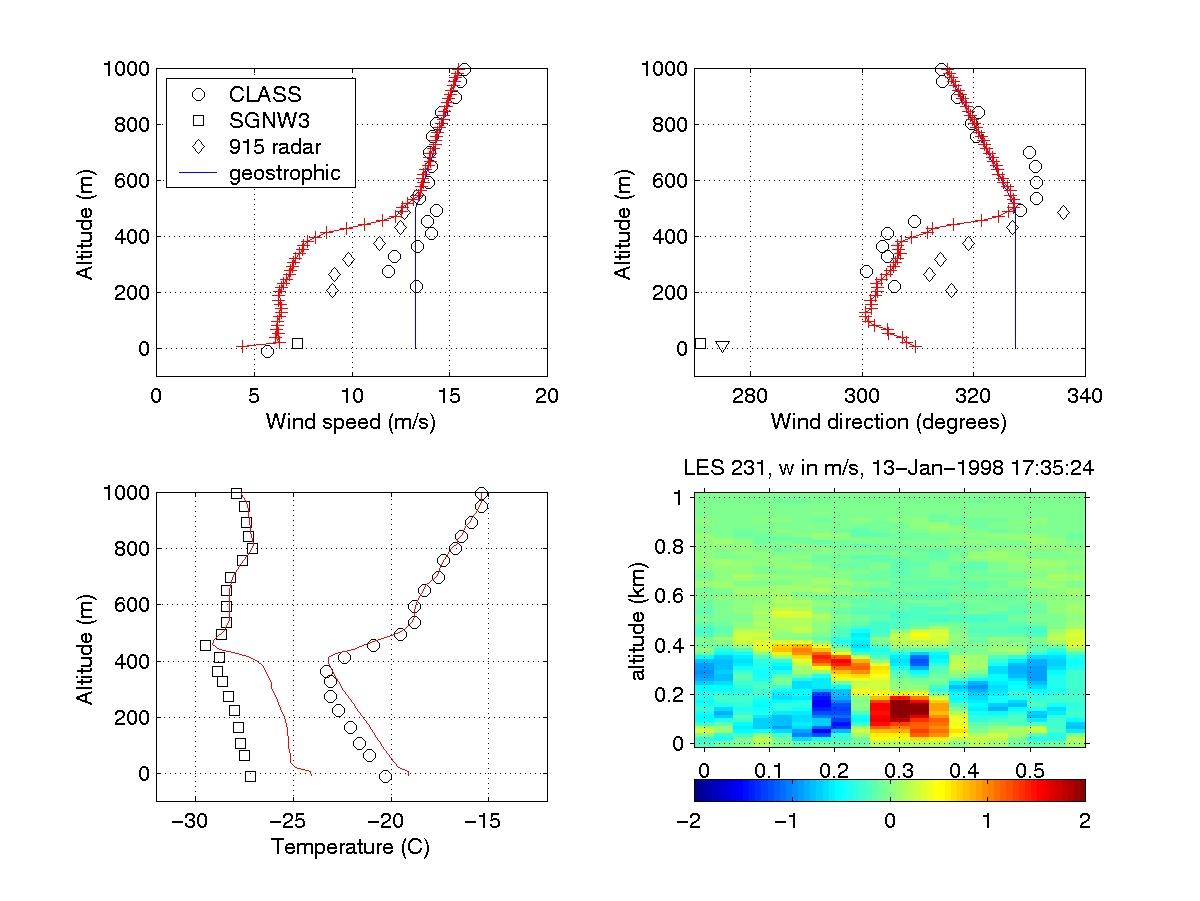
LES#231:
The following animation shows the
evolution of mean profiles (red lines) of wind speed, direction,
temperature and dewpoint as well as vertical velocity
on a east-west oriented vertical slice.

UW Lidar // Dec 13, 2000 // root@lidar.ssec.wisc.edu
Return to the
 Index
Index